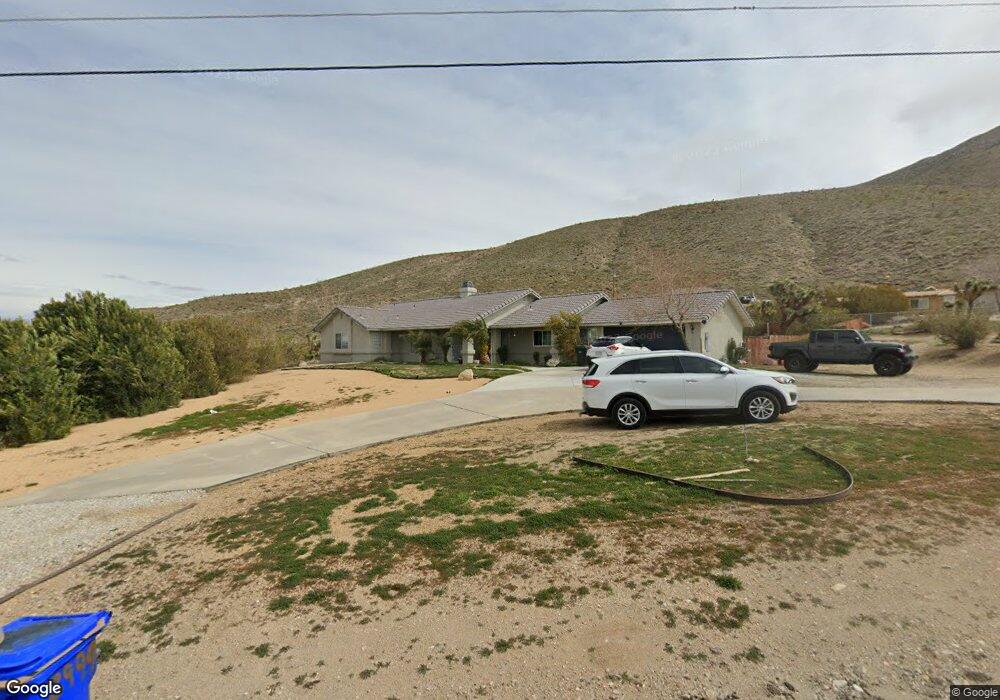
8999 Sagebrush St Apple Valley, CA 92308
High Desert NeighborhoodEstimated Value: $474,714 - $578,000
4
Beds
3
Baths
2,023
Sq Ft
$261/Sq Ft
Est. Value
About This Home
This home is located at 8999 Sagebrush St, Apple Valley, CA 92308 and is currently estimated at $528,179, approximately $261 per square foot. 8999 Sagebrush St is a home located in San Bernardino County with nearby schools including Mariana Academy and Apple Valley High School.
Ownership History
Date
Name
Owned For
Owner Type
Purchase Details
Closed on
Jul 31, 2020
Sold by
Eitile Pete
Bought by
Eitile Pete and Eitile Aja
Current Estimated Value
Purchase Details
Closed on
Jan 23, 2017
Sold by
Mays Melinda C
Bought by
Eitile Pete
Purchase Details
Closed on
Dec 16, 2013
Sold by
Seaman Richard J
Bought by
Mays Melinda C
Purchase Details
Closed on
Jul 8, 2004
Sold by
Varley Jon A
Bought by
Varley Jon A and Varley Rebecca V
Purchase Details
Closed on
Oct 17, 1996
Sold by
Federal Home Loan Mortgage Corporation
Bought by
Seaman Richard J and Seaman Melinda C
Home Financials for this Owner
Home Financials are based on the most recent Mortgage that was taken out on this home.
Original Mortgage
$65,000
Interest Rate
8.11%
Purchase Details
Closed on
Jul 10, 1996
Sold by
Dixon Robert H and Dixon Kathryn F
Bought by
Redlands Federal Bank
Create a Home Valuation Report for This Property
The Home Valuation Report is an in-depth analysis detailing your home's value as well as a comparison with similar homes in the area
Home Values in the Area
Average Home Value in this Area
Purchase History
| Date | Buyer | Sale Price | Title Company |
|---|---|---|---|
| Eitile Pete | -- | Accommodation | |
| Eitile Pete | $307,000 | First American Title Company | |
| May Melinda C | -- | First American Title Company | |
| Mays Melinda C | -- | None Available | |
| Varley Jon A | -- | -- | |
| Seaman Richard J | $125,000 | First American Title Ins Co | |
| Redlands Federal Bank | $110,000 | American Title Ins Co |
Source: Public Records
Mortgage History
| Date | Status | Borrower | Loan Amount |
|---|---|---|---|
| Previous Owner | Seaman Richard J | $65,000 |
Source: Public Records
Tax History Compared to Growth
Tax History
| Year | Tax Paid | Tax Assessment Tax Assessment Total Assessment is a certain percentage of the fair market value that is determined by local assessors to be the total taxable value of land and additions on the property. | Land | Improvement |
|---|---|---|---|---|
| 2025 | $5,043 | $439,499 | $47,913 | $391,586 |
| 2024 | $5,043 | $430,882 | $46,974 | $383,908 |
| 2023 | $5,000 | $422,433 | $46,053 | $376,380 |
| 2022 | $4,048 | $336,174 | $48,875 | $287,299 |
| 2021 | $3,958 | $329,583 | $47,917 | $281,666 |
| 2020 | $3,927 | $325,791 | $65,159 | $260,632 |
| 2019 | $3,857 | $319,403 | $63,881 | $255,522 |
| 2018 | $3,765 | $313,140 | $62,628 | $250,512 |
| 2017 | $2,223 | $175,414 | $28,065 | $147,349 |
| 2016 | $2,056 | $171,975 | $27,515 | $144,460 |
| 2015 | $2,021 | $169,392 | $27,102 | $142,290 |
| 2014 | $1,993 | $166,074 | $26,571 | $139,503 |
Source: Public Records
Map
Nearby Homes
- 21548 Sagebrush Ct
- 0 Joshua St Unit HD25197152
- 0 Juniper St
- 21080 Santa Rosa Rd
- 9191 Nambe Rd
- 9322 Candlelight St
- 9075 Mesa Vista St
- 0 Santa Rosa Unit IV25160108
- 0 Santa Rosa Unit CV25106891
- 26637 Santa Rosa Rd
- 26635 Santa Rosa Rd
- 26633 Santa Rosa Rd
- 9585 Juniper St
- 9564 Candlelight St
- 22255 Minto Ct
- 0 Ocotillo Way Unit OC25115091
- 0 Ocotillo Way Unit DW25109741
- 0 Ocotillo Way Unit HD25039457
- 0 Ocotillo Way Unit HD25030448
- 21972 Ocotillo Way
- 9041 Sagebrush St
- 8991 Sagebrush St
- 21555 Sagebrush Ct
- 8939 Sagebrush St
- 9040 Sagebrush St
- 8960 Sagebrush St
- 9002 Sagebrush St
- 9061 Sagebrush St
- 8928 Sagebrush St
- 28454 Santa Rosa Rd
- 9074 Sagebrush St
- 8955 Joshua St
- 9076 Sagebrush St
- 9049 Joshua St Unit A
- 8915 Joshua St
- 9021 Joshua St
- 21461 Picketwire Rd
- 9024 Joshua St
- 9140 Yucca St