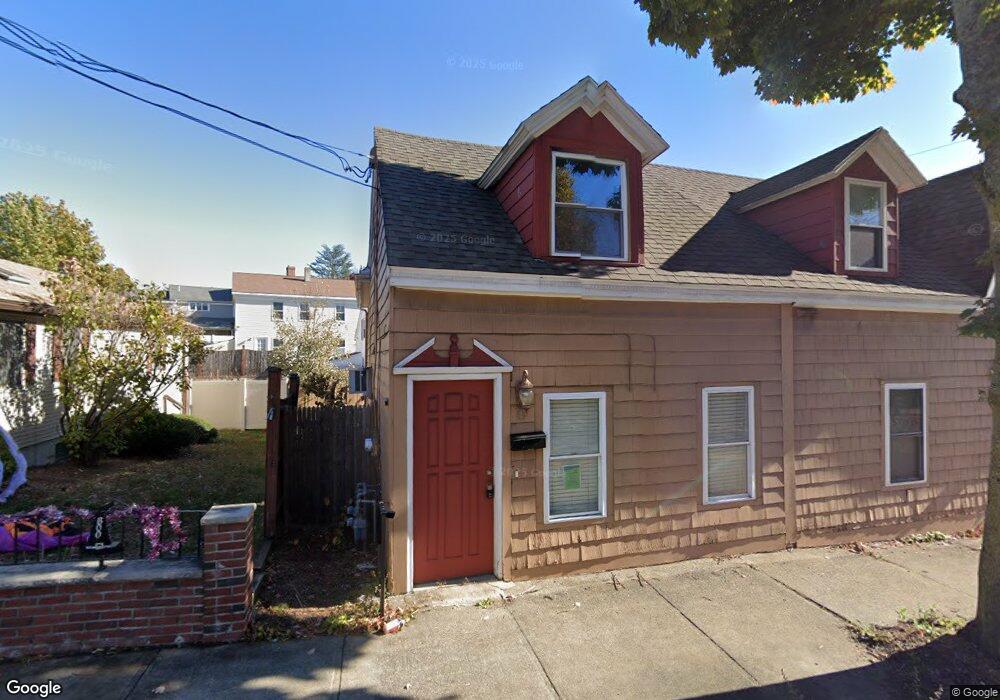
8A Aborn St Unit 8A Peabody, MA 01960
Peabody Town Center NeighborhoodEstimated Value: $389,000 - $494,774
2
Beds
1
Bath
1,400
Sq Ft
$302/Sq Ft
Est. Value
About This Home
This home is located at 8A Aborn St Unit 8A, Peabody, MA 01960 and is currently estimated at $422,194, approximately $301 per square foot. 8A Aborn St Unit 8A is a home located in Essex County with nearby schools including Peabody Veterans Memorial High School, St John The Baptist School, and The Phoenix School.
Ownership History
Date
Name
Owned For
Owner Type
Purchase Details
Closed on
Feb 24, 2020
Sold by
Balabonkin Mikhail and Smirnova Anna
Bought by
Smirnova Anna
Current Estimated Value
Purchase Details
Closed on
Jul 19, 2016
Sold by
Purdy Carrie
Bought by
Smirnova Anna and Balabonkin Mikhail
Home Financials for this Owner
Home Financials are based on the most recent Mortgage that was taken out on this home.
Original Mortgage
$237,500
Interest Rate
3.66%
Mortgage Type
New Conventional
Purchase Details
Closed on
Jan 13, 2012
Sold by
Soundview Home Loan T2 and Deutsche Bank Natl T C
Bought by
Cutler David
Purchase Details
Closed on
Jul 26, 2011
Sold by
Kaba Karamoh and Deutsche Bank Natl T C
Bought by
Soundview Home Loan T and Deutsche Bank Natl T C
Purchase Details
Closed on
Sep 27, 2006
Sold by
Finkelstein Adam
Bought by
Kaba Karamoh
Create a Home Valuation Report for This Property
The Home Valuation Report is an in-depth analysis detailing your home's value as well as a comparison with similar homes in the area
Home Values in the Area
Average Home Value in this Area
Purchase History
We collect this data history from publicly available records. To have your information removed, we recommend requesting removal directly through your county’s website.
| Date | Buyer | Sale Price | Title Company |
|---|---|---|---|
| Smirnova Anna | -- | None Available | |
| Smirnova Anna | -- | None Available | |
| Smirnova Anna | -- | None Available | |
| Smirnova Anna | $250,000 | -- | |
| Cutler David | $51,000 | -- | |
| Soundview Home Loan T | $207,372 | -- | |
| Soundview Home Loan T | $207,372 | -- | |
| Kaba Karamoh | $227,000 | -- | |
| Kaba Karamoh | $227,000 | -- |
Source: Public Records
Mortgage History
We collect this data history from publicly available records. To have your information removed, we recommend requesting removal directly through your county’s website.
| Date | Status | Borrower | Loan Amount |
|---|---|---|---|
| Previous Owner | Smirnova Anna | $237,500 |
Source: Public Records
Tax History
| Year | Tax Paid | Tax Assessment Tax Assessment Total Assessment is a certain percentage of the fair market value that is determined by local assessors to be the total taxable value of land and additions on the property. | Land | Improvement |
|---|---|---|---|---|
| 2025 | $3,282 | $354,400 | $0 | $354,400 |
| 2024 | $3,232 | $354,400 | $0 | $354,400 |
| 2023 | $2,918 | $306,500 | $0 | $306,500 |
| 2022 | $2,805 | $277,700 | $0 | $277,700 |
| 2021 | $2,612 | $249,000 | $0 | $249,000 |
| 2020 | $2,571 | $239,400 | $0 | $239,400 |
| 2019 | $2,583 | $234,600 | $0 | $234,600 |
| 2018 | $2,580 | $225,100 | $0 | $225,100 |
| 2017 | $2,478 | $210,700 | $0 | $210,700 |
| 2016 | $2,340 | $196,300 | $0 | $196,300 |
| 2015 | $2,355 | $191,500 | $0 | $191,500 |
Source: Public Records
Map
Nearby Homes
- 45.5 Aborn St Unit 2
- 80 Foster St Unit 504
- 64 Foster St Unit 403
- 5 Milk Street Extension
- 111 Foster St Unit 416
- 149 Washington St
- 18 Shillaber St
- 65 Ord St
- 46 Walnut St
- 6 Munroe St
- 24 Tracey St
- 24 Harris St Unit A
- 3 Witch Way
- 10 Crowninshield St Unit 106
- 16 Tremont St
- 112 Lowell St Unit 11
- 11 1/2 Albion St
- 16 Palmer Ave Unit 2
- 23 Putnam St
- 41 Northend St
- 60 Washington St
- 62 Washington St
- 70 Washington St
- 5 Aborn St
- 72 Washington St
- 65 Washington St
- 5 Aborn Place
- 7 Aborn Place
- 9 Aborn St
- 61 Washington St
- 69 Washington St
- 69 Washington St Unit 2
- 56 Washington St
- 59 Washington St
- 74 Washington St
- 8 Aborn St Unit 8A
- 8 Aborn St
- 8A Aborn St
- 8 Aborn St Unit 8
- 8A Aborn St Unit A
Your Personal Tour Guide
Ask me questions while you tour the home.