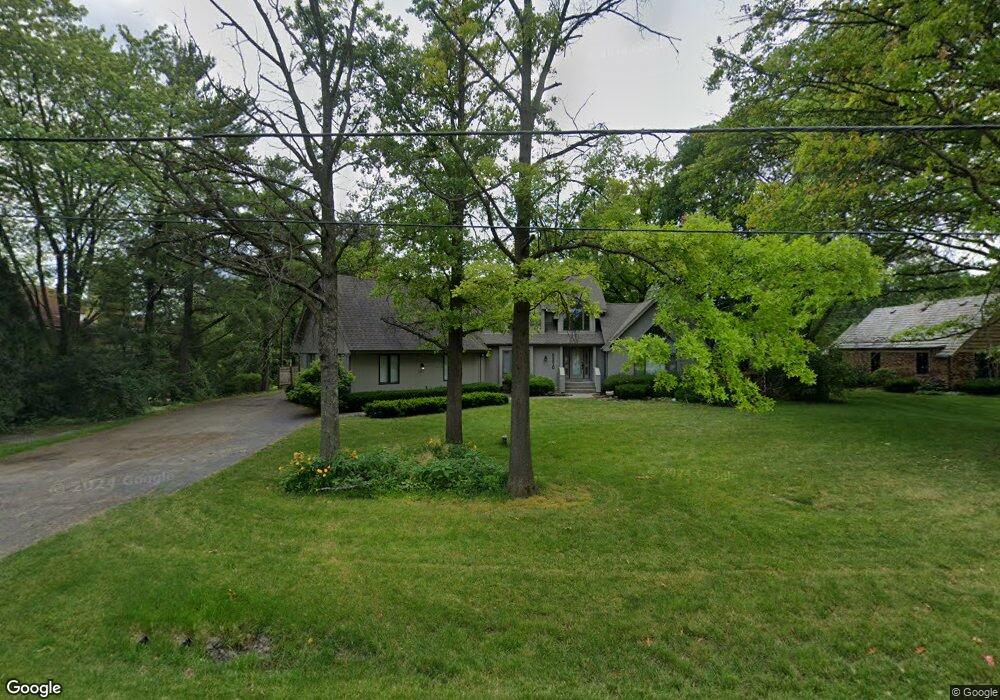
8S529 Oxford Ln Naperville, IL 60565
Meadow Glens NeighborhoodEstimated Value: $531,000 - $670,349
3
Beds
3
Baths
2,080
Sq Ft
$291/Sq Ft
Est. Value
About This Home
This home is located at 8S529 Oxford Ln, Naperville, IL 60565 and is currently estimated at $604,837, approximately $290 per square foot. 8S529 Oxford Ln is a home located in DuPage County with nearby schools including Maplebrook Elementary School, Lincoln Jr. High School, and Naperville Central High School.
Ownership History
Date
Name
Owned For
Owner Type
Purchase Details
Closed on
Sep 27, 2004
Sold by
Murphy James A and Murphy Sharon F
Bought by
Graham Arthur W and Graham Anna L
Current Estimated Value
Home Financials for this Owner
Home Financials are based on the most recent Mortgage that was taken out on this home.
Original Mortgage
$422,400
Outstanding Balance
$180,469
Interest Rate
3.75%
Mortgage Type
Purchase Money Mortgage
Estimated Equity
$424,368
Create a Home Valuation Report for This Property
The Home Valuation Report is an in-depth analysis detailing your home's value as well as a comparison with similar homes in the area
Home Values in the Area
Average Home Value in this Area
Purchase History
| Date | Buyer | Sale Price | Title Company |
|---|---|---|---|
| Graham Arthur W | $528,000 | First American Title Ins Co |
Source: Public Records
Mortgage History
| Date | Status | Borrower | Loan Amount |
|---|---|---|---|
| Open | Graham Arthur W | $422,400 | |
| Closed | Graham Arthur W | $52,800 |
Source: Public Records
Tax History Compared to Growth
Tax History
| Year | Tax Paid | Tax Assessment Tax Assessment Total Assessment is a certain percentage of the fair market value that is determined by local assessors to be the total taxable value of land and additions on the property. | Land | Improvement |
|---|---|---|---|---|
| 2024 | $11,784 | $210,089 | $87,020 | $123,069 |
| 2023 | $11,353 | $191,740 | $79,420 | $112,320 |
| 2022 | $10,842 | $182,610 | $75,640 | $106,970 |
| 2021 | $10,408 | $175,700 | $72,780 | $102,920 |
| 2020 | $10,172 | $172,540 | $71,470 | $101,070 |
| 2019 | $9,901 | $165,080 | $68,380 | $96,700 |
| 2018 | $9,627 | $160,270 | $66,390 | $93,880 |
| 2017 | $9,458 | $154,860 | $64,150 | $90,710 |
| 2016 | $9,590 | $154,840 | $64,140 | $90,700 |
| 2015 | $9,560 | $145,810 | $60,400 | $85,410 |
| 2014 | $9,803 | $145,810 | $60,400 | $85,410 |
| 2013 | $9,671 | $146,150 | $60,540 | $85,610 |
Source: Public Records
Map
Nearby Homes
- 8S452 Bell Dr
- 1449 Whitespire Ct Unit 5104
- 1408 Swallow St
- 128 E Bailey Rd Unit G
- 158 E Bailey Rd Unit F
- 138 E Bailey Rd Unit M
- 1751 S Washington St Unit 1
- 621 Bourbon Ct
- 213 Winding Creek Dr
- 517 Sheffield Rd
- 907 Secretariat Dr
- 1323 Auburn Ave
- 923 Tim Tam Cir
- 165 Tamarack Ave
- 1443 Meander Dr
- 1340 Auburn Ave
- 302 Carriage Hill Rd
- 1216 Tranquility Ct
- 1921 Wisteria Ct Unit 3
- 1006 Bankfield Ct