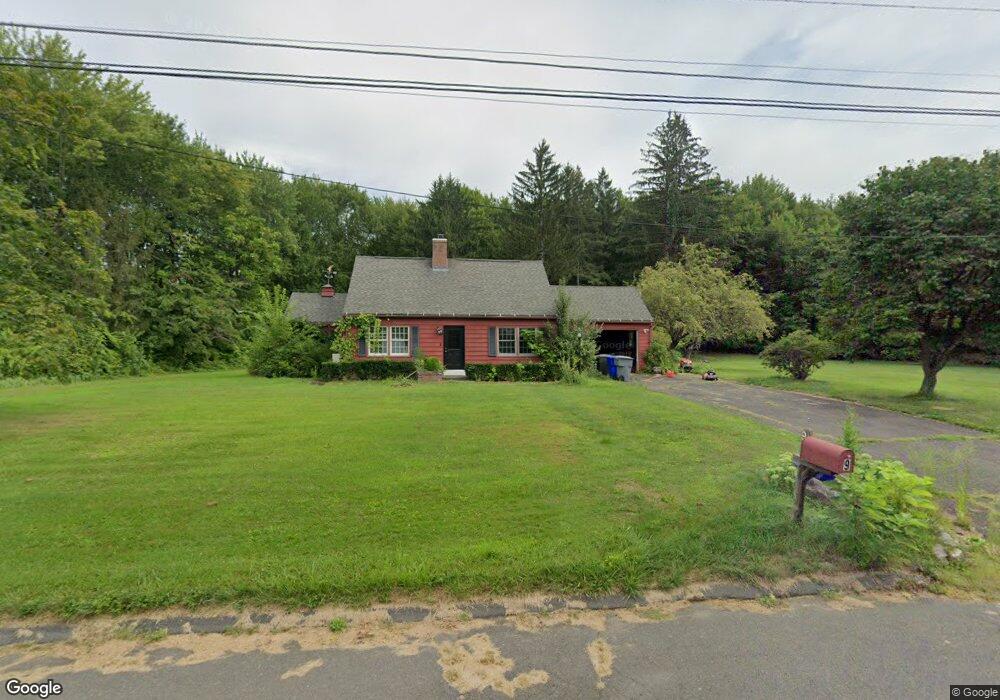
9 3rd St Enfield, CT 06082
Estimated Value: $322,000 - $409,000
2
Beds
2
Baths
1,554
Sq Ft
$226/Sq Ft
Est. Value
About This Home
This home is located at 9 3rd St, Enfield, CT 06082 and is currently estimated at $351,853, approximately $226 per square foot. 9 3rd St is a home located in Hartford County with nearby schools including Prudence Crandall Elementary School, Henry Barnard Elementary School, and Enfield High School.
Ownership History
Date
Name
Owned For
Owner Type
Purchase Details
Closed on
Jan 17, 2023
Sold by
Jasminski Paula
Bought by
Jasminski Paula M
Current Estimated Value
Purchase Details
Closed on
Jun 21, 2022
Sold by
Jasminski Ft
Bought by
Jasminski Paula
Create a Home Valuation Report for This Property
The Home Valuation Report is an in-depth analysis detailing your home's value as well as a comparison with similar homes in the area
Home Values in the Area
Average Home Value in this Area
Purchase History
| Date | Buyer | Sale Price | Title Company |
|---|---|---|---|
| Jasminski Paula M | -- | None Available | |
| Jasminski Paula | -- | None Available |
Source: Public Records
Tax History
| Year | Tax Paid | Tax Assessment Tax Assessment Total Assessment is a certain percentage of the fair market value that is determined by local assessors to be the total taxable value of land and additions on the property. | Land | Improvement |
|---|---|---|---|---|
| 2025 | $5,395 | $155,700 | $57,100 | $98,600 |
| 2024 | $5,264 | $155,700 | $57,100 | $98,600 |
| 2023 | $5,179 | $155,700 | $57,100 | $98,600 |
| 2022 | $4,763 | $155,700 | $57,100 | $98,600 |
| 2021 | $4,853 | $129,820 | $47,350 | $82,470 |
| 2020 | $4,853 | $129,820 | $47,350 | $82,470 |
| 2019 | $4,853 | $129,820 | $47,350 | $82,470 |
| 2018 | $4,745 | $129,820 | $47,350 | $82,470 |
| 2017 | $4,489 | $129,820 | $47,350 | $82,470 |
| 2016 | $4,351 | $127,920 | $47,350 | $80,570 |
| 2015 | $4,226 | $127,920 | $47,350 | $80,570 |
| 2014 | $4,129 | $127,920 | $47,350 | $80,570 |
Source: Public Records
Map
Nearby Homes
- 41 Field Rd
- 9 Eleanor Rd
- 73 Laurel St
- 9 Foxcroft Rd
- 9 Virginia Ave
- 23 Woodlawn Ave
- 2 Sharren Ln
- 15 Summer St
- 4 Marshall Dr
- 7 Pine Grove Ave
- 64 Hartford Ave
- 54 Hartford Ave
- 42 Hartford Ave
- 39 Union Street Extension
- 11 Willard Ave
- 127 Windsor St
- 20 Manning Rd
- 31 Sharren Ln
- 24 Ohear Ave
- 148 Pleasant St
Your Personal Tour Guide
Ask me questions while you tour the home.