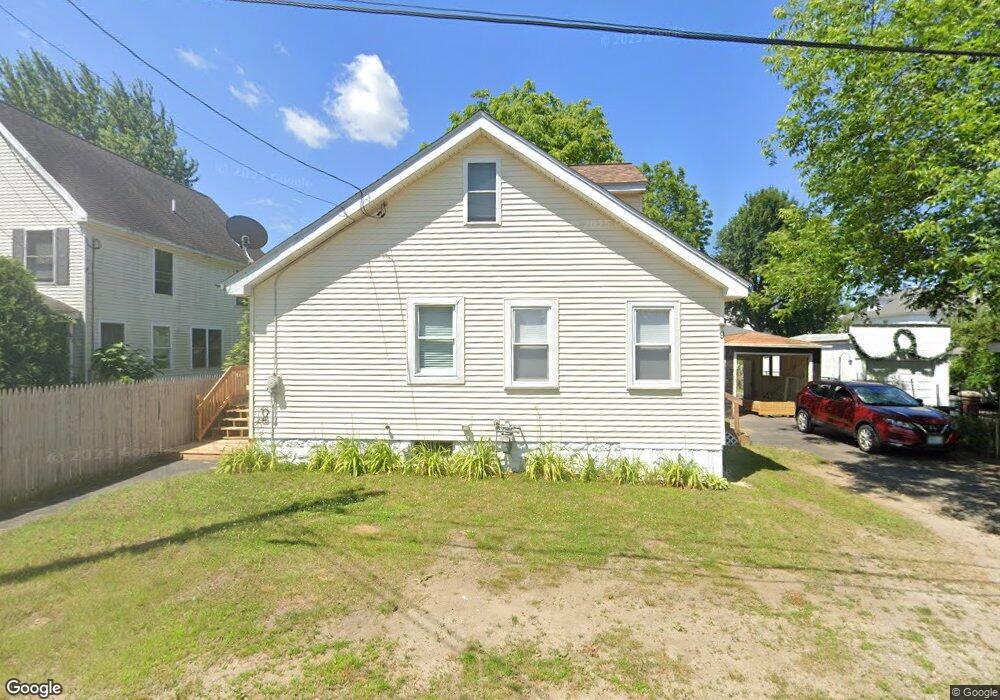
9 3rd St Nashua, NH 03060
Mine Falls Park NeighborhoodEstimated Value: $417,000 - $462,000
3
Beds
2
Baths
1,475
Sq Ft
$298/Sq Ft
Est. Value
About This Home
This home is located at 9 3rd St, Nashua, NH 03060 and is currently estimated at $439,484, approximately $297 per square foot. 9 3rd St is a home located in Hillsborough County with nearby schools including Ledge Street Elementary School, Fairgrounds Middle School, and Nashua High School South.
Ownership History
Date
Name
Owned For
Owner Type
Purchase Details
Closed on
Jul 18, 2024
Sold by
Noble Michael A and Noble Kelly J
Bought by
Noble
Current Estimated Value
Purchase Details
Closed on
Jul 28, 2011
Sold by
Lufburrow Blake
Bought by
Noble Michael A and Noble Kelly J
Home Financials for this Owner
Home Financials are based on the most recent Mortgage that was taken out on this home.
Original Mortgage
$127,200
Interest Rate
4.52%
Mortgage Type
Purchase Money Mortgage
Purchase Details
Closed on
Jan 20, 2006
Sold by
Third St Rt
Bought by
Lufburrow Blake
Purchase Details
Closed on
Jul 28, 2005
Sold by
Freeman James W
Bought by
Third St Rt
Purchase Details
Closed on
Sep 25, 1998
Sold by
Vanassa Armand H and Vanassa Irene A
Bought by
Martineau Daniel R
Create a Home Valuation Report for This Property
The Home Valuation Report is an in-depth analysis detailing your home's value as well as a comparison with similar homes in the area
Home Values in the Area
Average Home Value in this Area
Purchase History
| Date | Buyer | Sale Price | Title Company |
|---|---|---|---|
| Noble | -- | None Available | |
| Noble Michael A | $164,000 | -- | |
| Noble Michael A | $164,000 | -- | |
| Lufburrow Blake | $239,900 | -- | |
| Lufburrow Blake | $239,900 | -- | |
| Third St Rt | $175,000 | -- | |
| Third St Rt | $175,000 | -- | |
| Martineau Daniel R | $92,000 | -- | |
| Martineau Daniel R | $92,000 | -- |
Source: Public Records
Mortgage History
| Date | Status | Borrower | Loan Amount |
|---|---|---|---|
| Previous Owner | Martineau Daniel R | $140,000 | |
| Previous Owner | Martineau Daniel R | $127,200 |
Source: Public Records
Tax History
| Year | Tax Paid | Tax Assessment Tax Assessment Total Assessment is a certain percentage of the fair market value that is determined by local assessors to be the total taxable value of land and additions on the property. | Land | Improvement |
|---|---|---|---|---|
| 2025 | $6,340 | $376,700 | $127,900 | $248,800 |
| 2024 | $5,990 | $376,700 | $127,900 | $248,800 |
| 2023 | $6,038 | $331,200 | $102,300 | $228,900 |
| 2022 | $5,985 | $331,200 | $102,300 | $228,900 |
| 2021 | $4,988 | $214,800 | $64,800 | $150,000 |
| 2020 | $2,668 | $216,500 | $64,800 | $151,700 |
| 2019 | $2,631 | $216,500 | $64,800 | $151,700 |
| 2018 | $4,592 | $216,500 | $64,800 | $151,700 |
| 2017 | $2,523 | $149,800 | $63,300 | $86,500 |
| 2016 | $3,755 | $149,800 | $63,300 | $86,500 |
| 2015 | $3,660 | $149,200 | $63,300 | $85,900 |
| 2014 | $3,535 | $147,000 | $63,300 | $83,700 |
Source: Public Records
Map
Nearby Homes
Your Personal Tour Guide
Ask me questions while you tour the home.