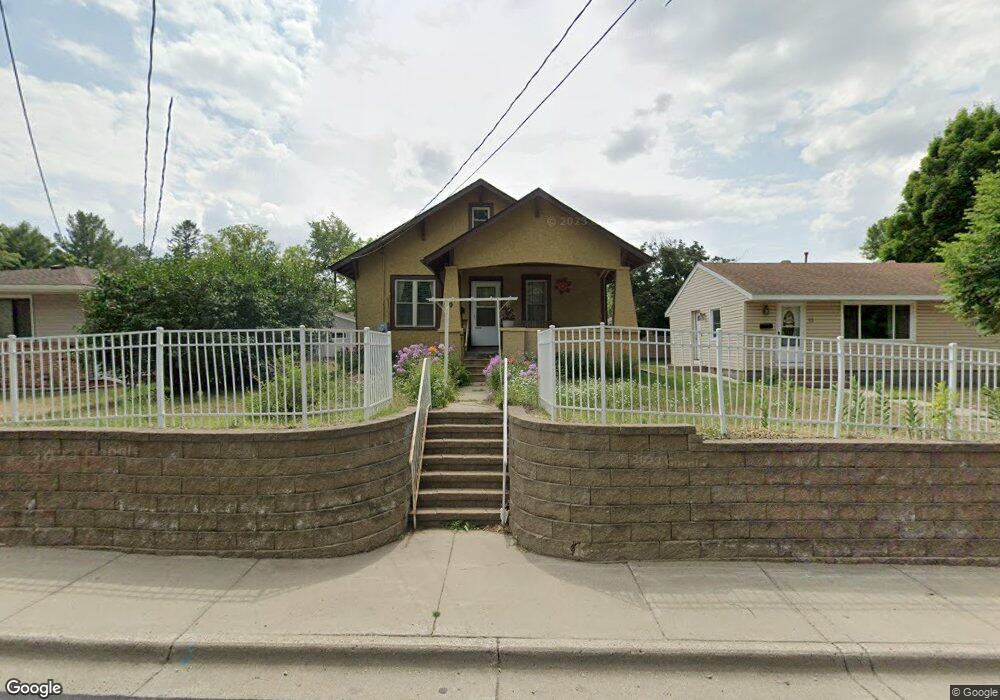
9 6th Ave N Sauk Rapids, MN 56379
Estimated Value: $185,680 - $198,000
3
Beds
1
Bath
1,136
Sq Ft
$167/Sq Ft
Est. Value
About This Home
This home is located at 9 6th Ave N, Sauk Rapids, MN 56379 and is currently estimated at $189,920, approximately $167 per square foot. 9 6th Ave N is a home located in Benton County with nearby schools including Mississippi Heights Elementary School, Sauk Rapids-Rice Middle School, and Sauk Rapids-Rice Senior High School.
Ownership History
Date
Name
Owned For
Owner Type
Purchase Details
Closed on
Mar 3, 2011
Sold by
Mohs Frankie
Bought by
Statz Cynthia R
Current Estimated Value
Purchase Details
Closed on
Aug 31, 2007
Sold by
Equity Builders Of St Cloud Llc
Bought by
Johnson Willard F and Johnson Janetta J
Purchase Details
Closed on
Apr 9, 2007
Sold by
Cruser Margaret M
Bought by
Equity Builders St Cloud Llc
Home Financials for this Owner
Home Financials are based on the most recent Mortgage that was taken out on this home.
Original Mortgage
$55,000
Interest Rate
6.19%
Mortgage Type
Future Advance Clause Open End Mortgage
Create a Home Valuation Report for This Property
The Home Valuation Report is an in-depth analysis detailing your home's value as well as a comparison with similar homes in the area
Home Values in the Area
Average Home Value in this Area
Purchase History
| Date | Buyer | Sale Price | Title Company |
|---|---|---|---|
| Statz Cynthia R | $87,000 | -- | |
| Johnson Willard F | $99,000 | -- | |
| Equity Builders St Cloud Llc | $52,500 | -- |
Source: Public Records
Mortgage History
| Date | Status | Borrower | Loan Amount |
|---|---|---|---|
| Previous Owner | Equity Builders St Cloud Llc | $55,000 |
Source: Public Records
Tax History Compared to Growth
Tax History
| Year | Tax Paid | Tax Assessment Tax Assessment Total Assessment is a certain percentage of the fair market value that is determined by local assessors to be the total taxable value of land and additions on the property. | Land | Improvement |
|---|---|---|---|---|
| 2025 | $2,168 | $152,700 | $25,000 | $127,700 |
| 2024 | $2,222 | $146,300 | $25,000 | $121,300 |
| 2023 | $1,442 | $146,000 | $25,000 | $121,000 |
| 2022 | $1,452 | $129,800 | $22,800 | $107,000 |
| 2021 | $1,330 | $121,000 | $22,800 | $98,200 |
| 2018 | $1,154 | $74,800 | $15,935 | $58,865 |
| 2017 | $1,154 | $68,500 | $15,465 | $53,035 |
| 2016 | $1,130 | $94,700 | $21,900 | $72,800 |
| 2015 | $1,124 | $59,900 | $14,723 | $45,177 |
| 2014 | -- | $55,500 | $14,283 | $41,217 |
| 2013 | -- | $57,200 | $14,465 | $42,735 |
Source: Public Records
Map
Nearby Homes
- 117 6th Ave N
- 216 8th Ave N
- 112 Summit Ave S
- 100 9th Ave S
- 615 3rd Ave N
- 608 Summit Ave S
- 224 9th St N
- 1101 10th Ave N
- 1107 10th Ave N
- 1105 Summit Ave N
- 2021 Hillcrest Dr
- 1804 8th Ave S
- 1803 8th Ave S
- 3300 321st St
- 3322 321st St
- 752 12th St N
- 1201 10th Ave N
- 314 Pleasant Ridge Dr
- 2161 Mill Pond Dr
- 1021 5th St S