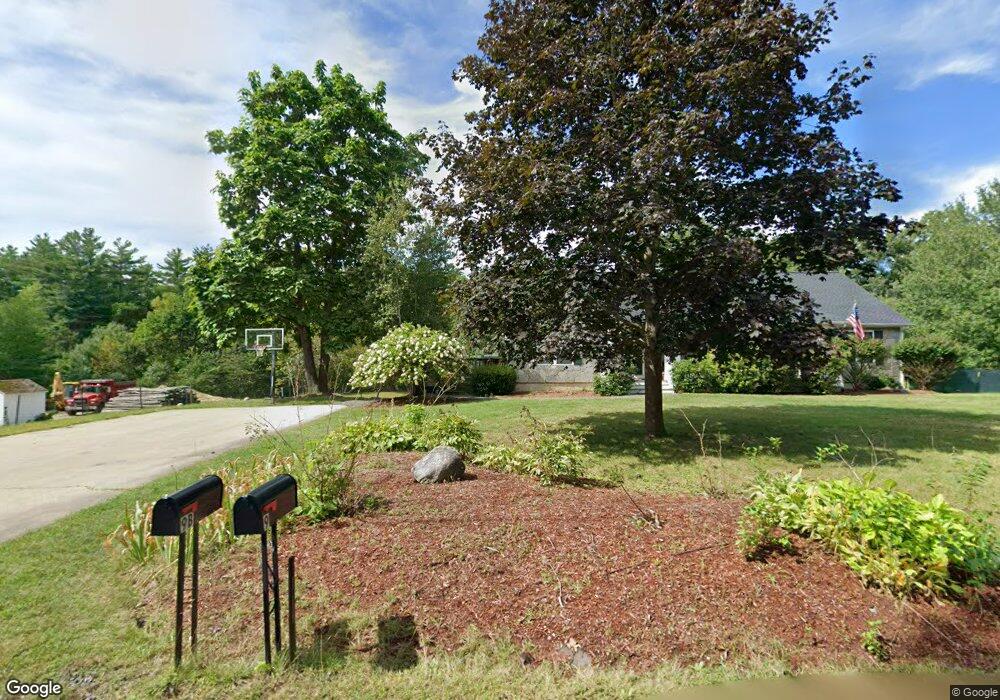
9-9B Dutton Ln Hollis, NH 03049
Southwest Nashua NeighborhoodEstimated Value: $524,000 - $830,000
3
Beds
2
Baths
1,860
Sq Ft
$367/Sq Ft
Est. Value
About This Home
This home is located at 9-9B Dutton Ln, Hollis, NH 03049 and is currently estimated at $682,935, approximately $367 per square foot. 9-9B Dutton Ln is a home with nearby schools including Hollis Primary School, Hollis Upper Elementary School, and Hollis-Brookline Middle School.
Ownership History
Date
Name
Owned For
Owner Type
Purchase Details
Closed on
Mar 13, 2007
Sold by
Picard Donald
Bought by
Picard Bruce
Current Estimated Value
Home Financials for this Owner
Home Financials are based on the most recent Mortgage that was taken out on this home.
Original Mortgage
$331,500
Outstanding Balance
$201,091
Interest Rate
6.3%
Mortgage Type
Purchase Money Mortgage
Estimated Equity
$481,844
Purchase Details
Closed on
Jun 3, 2004
Sold by
Picard Bruce and Picard Donald
Bought by
Furley Corp
Create a Home Valuation Report for This Property
The Home Valuation Report is an in-depth analysis detailing your home's value as well as a comparison with similar homes in the area
Home Values in the Area
Average Home Value in this Area
Purchase History
| Date | Buyer | Sale Price | Title Company |
|---|---|---|---|
| Picard Bruce | $124,000 | -- | |
| Furley Corp | $4,000 | -- |
Source: Public Records
Mortgage History
| Date | Status | Borrower | Loan Amount |
|---|---|---|---|
| Open | Furley Corp | $331,500 |
Source: Public Records
Tax History Compared to Growth
Tax History
| Year | Tax Paid | Tax Assessment Tax Assessment Total Assessment is a certain percentage of the fair market value that is determined by local assessors to be the total taxable value of land and additions on the property. | Land | Improvement |
|---|---|---|---|---|
| 2024 | $10,900 | $614,800 | $242,800 | $372,000 |
| 2023 | $10,243 | $614,800 | $242,800 | $372,000 |
| 2022 | $13,876 | $614,800 | $242,800 | $372,000 |
| 2021 | $7,852 | $345,900 | $124,700 | $221,200 |
| 2020 | $8,018 | $345,900 | $124,700 | $221,200 |
| 2019 | $7,990 | $345,900 | $124,700 | $221,200 |
| 2018 | $7,496 | $345,900 | $124,700 | $221,200 |
| 2017 | $6,292 | $271,800 | $112,000 | $159,800 |
| 2016 | $6,368 | $271,800 | $112,000 | $159,800 |
| 2015 | $6,257 | $271,800 | $112,000 | $159,800 |
| 2014 | $6,377 | $275,700 | $115,900 | $159,800 |
| 2013 | -- | $275,700 | $115,900 | $159,800 |
Source: Public Records
Map
Nearby Homes