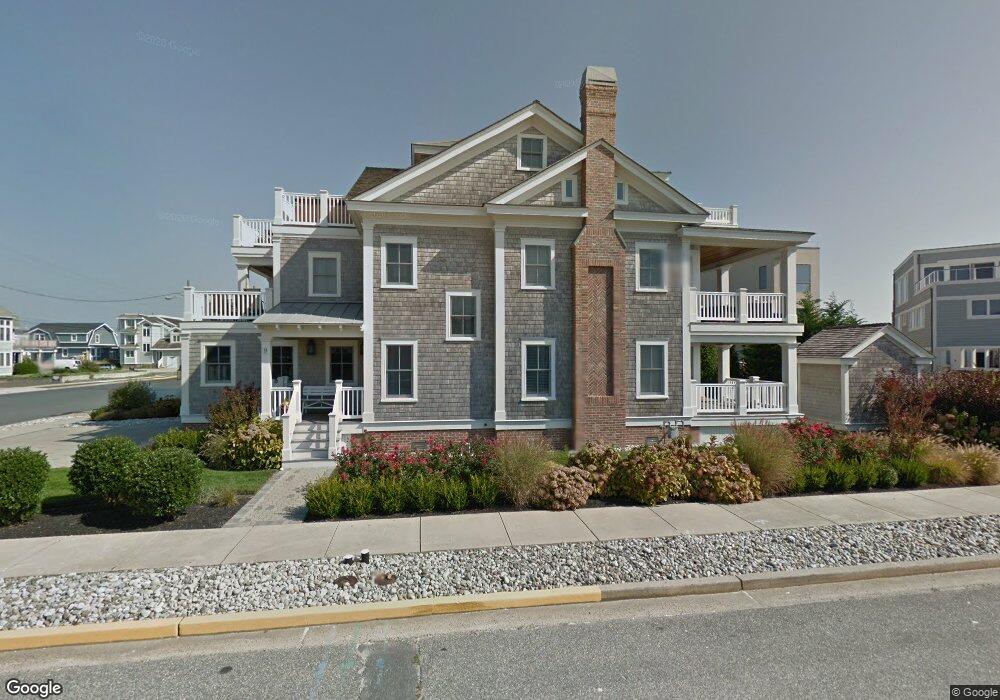
9 9th St E Avalon, NJ 08202
Estimated Value: $4,811,624 - $5,237,000
Studio
--
Bath
3,898
Sq Ft
$1,279/Sq Ft
Est. Value
About This Home
This home is located at 9 9th St E, Avalon, NJ 08202 and is currently estimated at $4,986,156, approximately $1,279 per square foot. 9 9th St E is a home located in Cape May County with nearby schools including Avalon Elementary School.
Ownership History
Date
Name
Owned For
Owner Type
Purchase Details
Closed on
Dec 18, 2012
Sold by
Mccormick Maria Theresa and Mccormick Joseph A
Bought by
Carzo Kathleen and Field Maria Claire
Current Estimated Value
Purchase Details
Closed on
Jan 28, 1992
Sold by
Mccormick Maria Theresa
Bought by
Mccormick Joseph A and Mccormick Maria T
Purchase Details
Closed on
Nov 30, 1990
Sold by
Mccormick Jr Jos A and Mccormick Maria T
Bought by
Mccormick Maria T
Purchase Details
Closed on
Oct 7, 1988
Sold by
Stowe Lewis
Bought by
Mccormick Joseph and Mccormick Maria
Create a Home Valuation Report for This Property
The Home Valuation Report is an in-depth analysis detailing your home's value as well as a comparison with similar homes in the area
Home Values in the Area
Average Home Value in this Area
Purchase History
| Date | Buyer | Sale Price | Title Company |
|---|---|---|---|
| Carzo Kathleen | -- | None Available | |
| Mccormick Joseph A | -- | -- | |
| Mccormick Maria T | -- | -- | |
| Mccormick Joseph | $460,000 | -- |
Source: Public Records
Tax History Compared to Growth
Tax History
| Year | Tax Paid | Tax Assessment Tax Assessment Total Assessment is a certain percentage of the fair market value that is determined by local assessors to be the total taxable value of land and additions on the property. | Land | Improvement |
|---|---|---|---|---|
| 2025 | $18,588 | $3,027,300 | $2,105,000 | $922,300 |
| 2024 | $18,588 | $3,027,300 | $2,105,000 | $922,300 |
| 2023 | $18,436 | $3,027,300 | $2,105,000 | $922,300 |
| 2022 | $17,195 | $3,027,300 | $2,105,000 | $922,300 |
| 2021 | $16,559 | $3,027,300 | $2,105,000 | $922,300 |
| 2020 | $15,924 | $3,027,300 | $2,105,000 | $922,300 |
| 2019 | $15,439 | $3,027,300 | $2,105,000 | $922,300 |
| 2018 | $14,773 | $3,027,300 | $2,105,000 | $922,300 |
| 2017 | $14,005 | $2,518,900 | $1,680,000 | $838,900 |
| 2016 | $13,751 | $2,500,100 | $1,680,000 | $820,100 |
| 2015 | $13,526 | $2,500,100 | $1,680,000 | $820,100 |
| 2014 | $13,376 | $2,500,100 | $1,680,000 | $820,100 |
Source: Public Records
Map
Nearby Homes