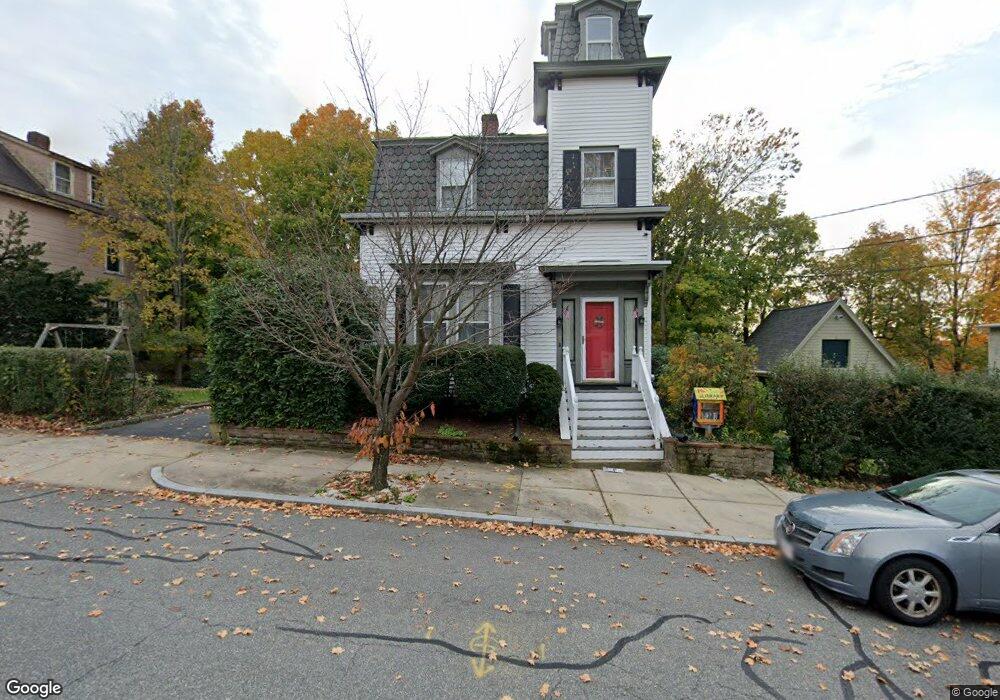
9 Albion St Hyde Park, MA 02136
Hyde Park NeighborhoodEstimated Value: $787,371 - $912,000
3
Beds
2
Baths
1,998
Sq Ft
$423/Sq Ft
Est. Value
About This Home
This home is located at 9 Albion St, Hyde Park, MA 02136 and is currently estimated at $844,593, approximately $422 per square foot. 9 Albion St is a home located in Suffolk County with nearby schools including Boston Renaissance Charter Public School, Boston Preparatory Charter Public School, and New Beginnings Academy.
Ownership History
Date
Name
Owned For
Owner Type
Purchase Details
Closed on
Aug 25, 2005
Sold by
Mills Alexander S
Bought by
Brown Alison C and Brown Peter T
Current Estimated Value
Home Financials for this Owner
Home Financials are based on the most recent Mortgage that was taken out on this home.
Original Mortgage
$350,000
Interest Rate
5.68%
Mortgage Type
Purchase Money Mortgage
Purchase Details
Closed on
Oct 20, 1995
Sold by
Kunze Paul G and Kunze Dorothea
Bought by
Mills Alexander S
Create a Home Valuation Report for This Property
The Home Valuation Report is an in-depth analysis detailing your home's value as well as a comparison with similar homes in the area
Home Values in the Area
Average Home Value in this Area
Purchase History
| Date | Buyer | Sale Price | Title Company |
|---|---|---|---|
| Brown Alison C | $457,000 | -- | |
| Mills Alexander S | $132,000 | -- |
Source: Public Records
Mortgage History
| Date | Status | Borrower | Loan Amount |
|---|---|---|---|
| Open | Mills Alexander S | $325,000 | |
| Closed | Brown Alison C | $350,000 | |
| Previous Owner | Mills Alexander S | $222,000 |
Source: Public Records
Tax History
| Year | Tax Paid | Tax Assessment Tax Assessment Total Assessment is a certain percentage of the fair market value that is determined by local assessors to be the total taxable value of land and additions on the property. | Land | Improvement |
|---|---|---|---|---|
| 2025 | $7,735 | $668,000 | $215,200 | $452,800 |
| 2024 | $6,564 | $602,200 | $196,700 | $405,500 |
| 2023 | $6,468 | $602,200 | $196,700 | $405,500 |
| 2022 | $6,069 | $557,800 | $182,200 | $375,600 |
| 2021 | $5,452 | $511,000 | $168,700 | $342,300 |
| 2020 | $5,255 | $497,600 | $155,600 | $342,000 |
| 2019 | $4,897 | $464,600 | $131,700 | $332,900 |
| 2018 | $4,776 | $455,700 | $131,700 | $324,000 |
| 2017 | $4,826 | $455,700 | $131,700 | $324,000 |
| 2016 | $4,227 | $384,300 | $127,200 | $257,100 |
| 2015 | $4,093 | $338,000 | $100,000 | $238,000 |
| 2014 | $4,169 | $331,400 | $100,000 | $231,400 |
Source: Public Records
Map
Nearby Homes
- 0 Truman Pkwy
- 722 Truman Hwy
- 49 Summit St
- 58 Oak St
- 79 Maple St Unit 3
- 755-759 Truman Pkwy
- 6 Kinsale Ln
- 34 Oak St Unit 103
- 34 Oak St Unit 104
- 34 Oak St Unit 302
- 5 Kinsale Ln
- 107 West St
- 76 Business St
- 1139 Hyde Park Ave
- 200 Robbins St
- 350 Blue Hill Ave
- 405 Blue Hill Ave
- 14 Winter St
- 106 Lewiston St
- 75-77 Belnel Rd
Your Personal Tour Guide
Ask me questions while you tour the home.