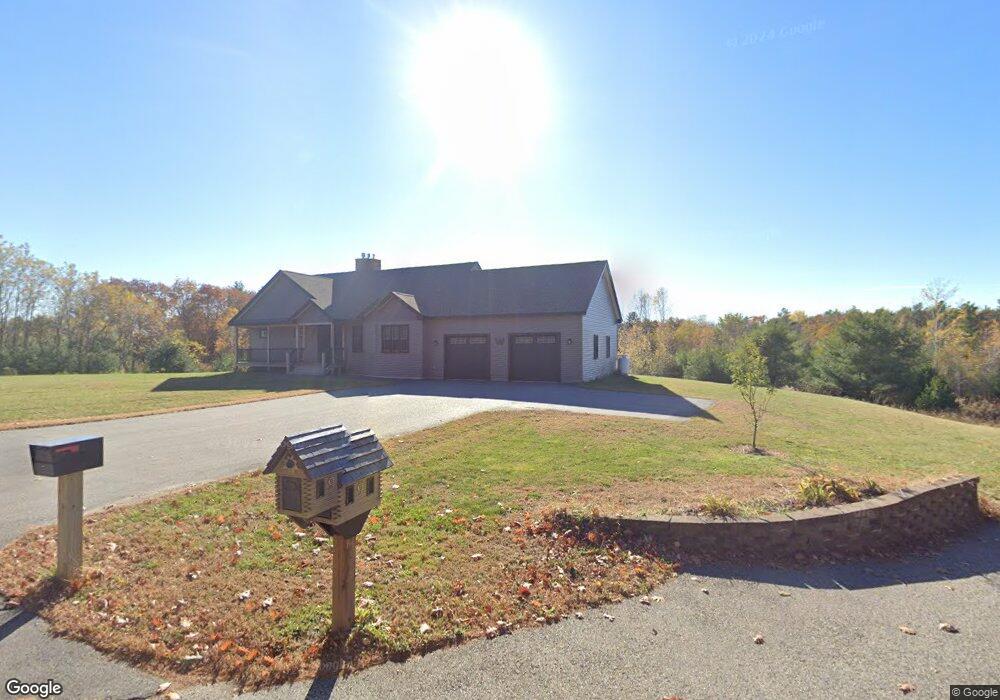
9 Andrews Rd Biddeford, ME 04005
North Biddeford NeighborhoodEstimated Value: $638,000 - $667,000
3
Beds
1
Bath
2,014
Sq Ft
$322/Sq Ft
Est. Value
About This Home
This home is located at 9 Andrews Rd, Biddeford, ME 04005 and is currently estimated at $648,590, approximately $322 per square foot. 9 Andrews Rd is a home located in York County with nearby schools including John F Kennedy Memorial School, Biddeford Intermediate School, and Biddeford Primary School.
Ownership History
Date
Name
Owned For
Owner Type
Purchase Details
Closed on
Aug 27, 2024
Sold by
Thebarge Gary E and Thebarge Jeanine C
Bought by
J and Thebarge G
Current Estimated Value
Purchase Details
Closed on
Nov 4, 2021
Sold by
Thebarge Gary E and Thebarge Chad G
Bought by
Thebarge Gary E and Thebarge Jeanine C
Purchase Details
Closed on
May 21, 2019
Sold by
Thebarge Gary and Thebarge Jeanine
Bought by
Thebarge Gary
Create a Home Valuation Report for This Property
The Home Valuation Report is an in-depth analysis detailing your home's value as well as a comparison with similar homes in the area
Home Values in the Area
Average Home Value in this Area
Purchase History
| Date | Buyer | Sale Price | Title Company |
|---|---|---|---|
| J | -- | None Available | |
| J | -- | None Available | |
| Thebarge Gary E | -- | None Available | |
| Thebarge Gary E | -- | None Available | |
| Thebarge Gary | -- | -- | |
| Thebarge Gary | -- | -- |
Source: Public Records
Tax History Compared to Growth
Tax History
| Year | Tax Paid | Tax Assessment Tax Assessment Total Assessment is a certain percentage of the fair market value that is determined by local assessors to be the total taxable value of land and additions on the property. | Land | Improvement |
|---|---|---|---|---|
| 2024 | $8,222 | $578,200 | $177,100 | $401,100 |
| 2023 | $7,586 | $578,200 | $177,100 | $401,100 |
| 2022 | $7,453 | $454,200 | $76,600 | $377,600 |
| 2021 | $7,155 | $392,500 | $63,800 | $328,700 |
| 2020 | $7,142 | $356,200 | $50,500 | $305,700 |
| 2019 | $7,137 | $357,200 | $51,500 | $305,700 |
| 2018 | $7,037 | $357,200 | $51,500 | $305,700 |
| 2017 | $6,477 | $322,700 | $51,500 | $271,200 |
| 2016 | $6,409 | $322,700 | $51,500 | $271,200 |
| 2015 | $6,088 | $322,700 | $51,500 | $271,200 |
| 2014 | $5,938 | $322,700 | $51,500 | $271,200 |
| 2013 | -- | $360,300 | $52,900 | $307,400 |
Source: Public Records
Map
Nearby Homes