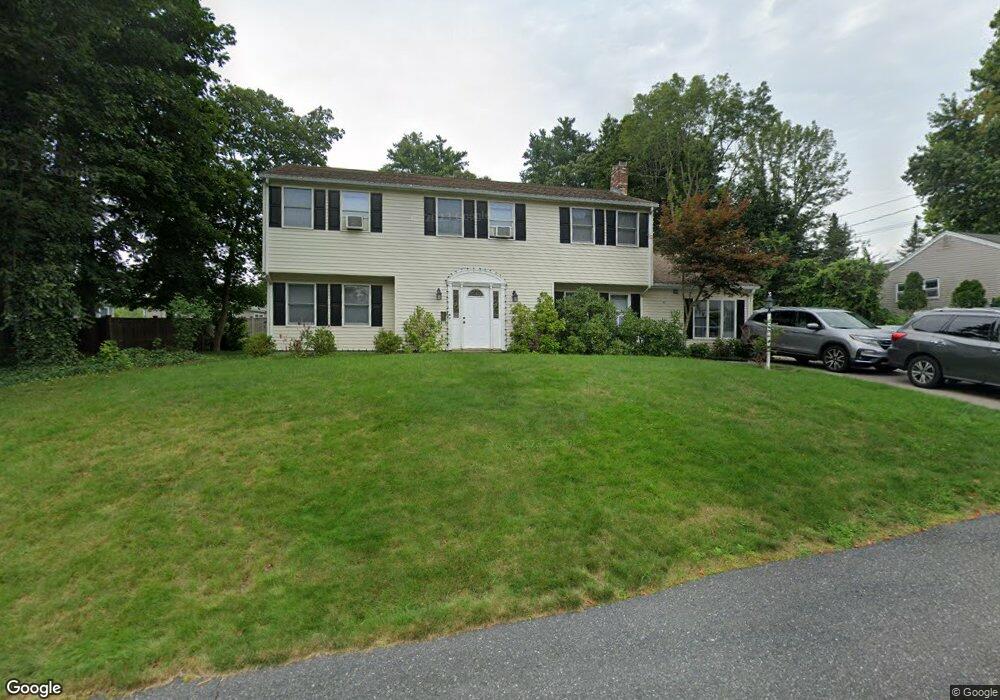
9 Appleton Rd Natick, MA 01760
Estimated Value: $1,049,334 - $1,145,000
4
Beds
3
Baths
2,444
Sq Ft
$453/Sq Ft
Est. Value
About This Home
This home is located at 9 Appleton Rd, Natick, MA 01760 and is currently estimated at $1,108,084, approximately $453 per square foot. 9 Appleton Rd is a home located in Middlesex County with nearby schools including Natick High School, Bennett-Hemenway (Ben-Hem) Elementary School, and Wilson Middle School.
Ownership History
Date
Name
Owned For
Owner Type
Purchase Details
Closed on
Feb 25, 2009
Sold by
Mccarthy Gary E and Mccarthy Susan M
Bought by
Federici Corinne J and Federici David A
Current Estimated Value
Home Financials for this Owner
Home Financials are based on the most recent Mortgage that was taken out on this home.
Original Mortgage
$380,000
Outstanding Balance
$239,958
Interest Rate
5%
Mortgage Type
Purchase Money Mortgage
Estimated Equity
$868,126
Create a Home Valuation Report for This Property
The Home Valuation Report is an in-depth analysis detailing your home's value as well as a comparison with similar homes in the area
Home Values in the Area
Average Home Value in this Area
Purchase History
| Date | Buyer | Sale Price | Title Company |
|---|---|---|---|
| Federici Corinne J | $475,000 | -- |
Source: Public Records
Mortgage History
| Date | Status | Borrower | Loan Amount |
|---|---|---|---|
| Open | Federici Corinne J | $380,000 |
Source: Public Records
Tax History
| Year | Tax Paid | Tax Assessment Tax Assessment Total Assessment is a certain percentage of the fair market value that is determined by local assessors to be the total taxable value of land and additions on the property. | Land | Improvement |
|---|---|---|---|---|
| 2025 | $9,790 | $818,600 | $462,400 | $356,200 |
| 2024 | $9,513 | $775,900 | $436,700 | $339,200 |
| 2023 | $9,261 | $732,700 | $409,900 | $322,800 |
| 2022 | $9,031 | $677,000 | $373,000 | $304,000 |
| 2021 | $5,057 | $635,000 | $352,600 | $282,400 |
| 2020 | $8,434 | $619,700 | $337,300 | $282,400 |
| 2019 | $7,876 | $619,700 | $337,300 | $282,400 |
| 2018 | $7,923 | $607,100 | $306,600 | $300,500 |
| 2017 | $7,668 | $568,400 | $273,300 | $295,100 |
| 2016 | $7,473 | $550,700 | $258,300 | $292,400 |
| 2015 | $7,233 | $523,400 | $258,300 | $265,100 |
Source: Public Records
Map
Nearby Homes
Your Personal Tour Guide
Ask me questions while you tour the home.