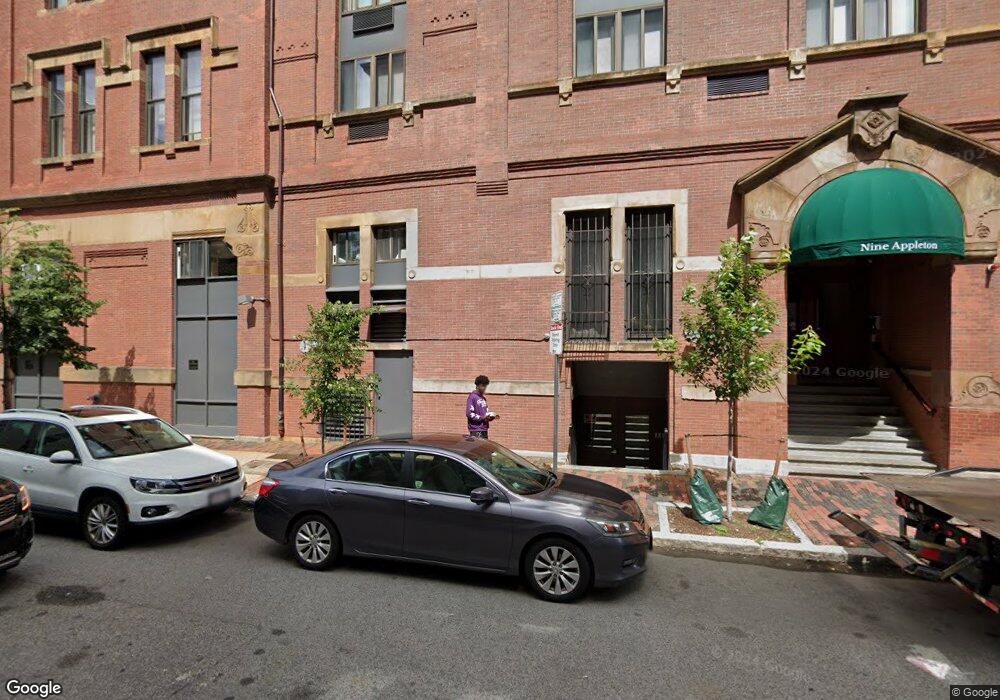
9 Appleton St Unit 405 Boston, MA 02116
South End NeighborhoodEstimated Value: $668,000 - $746,000
1
Bed
1
Bath
600
Sq Ft
$1,195/Sq Ft
Est. Value
About This Home
This home is located at 9 Appleton St Unit 405, Boston, MA 02116 and is currently estimated at $716,994, approximately $1,194 per square foot. 9 Appleton St Unit 405 is a home located in Suffolk County with nearby schools including Kingsley Montessori School and Cathedral High School.
Ownership History
Date
Name
Owned For
Owner Type
Purchase Details
Closed on
Jan 10, 2024
Sold by
Daniel Anthony Strollo Lt and Strollo
Bought by
Xie Xiaojun
Current Estimated Value
Purchase Details
Closed on
Feb 27, 2023
Sold by
Strollo Daniel and Strollo Kerry
Bought by
Daniel A Strollo Lt and Strollo
Purchase Details
Closed on
Oct 26, 2004
Sold by
Collins Investments Ll and Newhall
Bought by
Strollo Kerry and Strollo Daniel
Home Financials for this Owner
Home Financials are based on the most recent Mortgage that was taken out on this home.
Original Mortgage
$200,000
Interest Rate
5.85%
Mortgage Type
Purchase Money Mortgage
Purchase Details
Closed on
Oct 4, 2004
Sold by
Collins Investments Ll and Newhall
Bought by
Loughridge Nancy S and Wong Tin C
Home Financials for this Owner
Home Financials are based on the most recent Mortgage that was taken out on this home.
Original Mortgage
$200,000
Interest Rate
5.85%
Mortgage Type
Purchase Money Mortgage
Create a Home Valuation Report for This Property
The Home Valuation Report is an in-depth analysis detailing your home's value as well as a comparison with similar homes in the area
Home Values in the Area
Average Home Value in this Area
Purchase History
| Date | Buyer | Sale Price | Title Company |
|---|---|---|---|
| Xie Xiaojun | $680,000 | None Available | |
| Daniel A Strollo Lt | -- | None Available | |
| Strollo Kerry | $250,000 | -- | |
| Loughridge Nancy S | $340,000 | -- |
Source: Public Records
Mortgage History
| Date | Status | Borrower | Loan Amount |
|---|---|---|---|
| Previous Owner | Loughridge Nancy S | $275,000 | |
| Previous Owner | Loughridge Nancy S | $200,000 | |
| Previous Owner | Loughridge Nancy S | $272,000 |
Source: Public Records
Tax History
| Year | Tax Paid | Tax Assessment Tax Assessment Total Assessment is a certain percentage of the fair market value that is determined by local assessors to be the total taxable value of land and additions on the property. | Land | Improvement |
|---|---|---|---|---|
| 2025 | $7,852 | $678,100 | $0 | $678,100 |
| 2024 | $7,109 | $652,200 | $0 | $652,200 |
| 2023 | $6,797 | $632,900 | $0 | $632,900 |
| 2022 | $6,557 | $602,700 | $0 | $602,700 |
| 2021 | $6,431 | $602,700 | $0 | $602,700 |
| 2020 | $5,681 | $538,000 | $0 | $538,000 |
| 2019 | $5,506 | $522,400 | $0 | $522,400 |
| 2018 | $5,165 | $492,800 | $0 | $492,800 |
| 2017 | $4,925 | $465,100 | $0 | $465,100 |
| 2016 | $4,919 | $447,200 | $0 | $447,200 |
| 2015 | $4,894 | $404,100 | $0 | $404,100 |
| 2014 | $4,666 | $370,900 | $0 | $370,900 |
Source: Public Records
Map
Nearby Homes
- 7 Warren Ave Unit 19
- 44 Appleton St
- 48 Appleton St
- 39 Warren Ave Unit G
- 53 Clarendon St Unit 3
- 1-5 Cortes St
- 42 Clarendon St Unit 1
- 36 Milford St Unit 2
- 36 Milford St Unit 1
- 75 Clarendon St Unit 201
- 70 Clarendon St Unit 1
- 118 Chandler St Unit 2
- 2 Clarendon St Unit 204
- 32 Hanson St Unit 2
- 285 Columbus Ave Unit 805
- 13 Stanhope St Unit 1
- 2A Milford St Unit 12
- 19 Stanhope St Unit 2B
- 19 Stanhope St Unit 2C
- 109 Appleton St
- 9 Appleton St Unit 407
- 9 Appleton St Unit 406
- 9 Appleton St Unit 404
- 9 Appleton St Unit 403
- 9 Appleton St Unit 402
- 9 Appleton St Unit 401
- 9 Appleton St Unit 400
- 9 Appleton St Unit 310
- 9 Appleton St Unit 309
- 9 Appleton St Unit 308
- 9 Appleton St Unit 307
- 9 Appleton St Unit 306
- 9 Appleton St Unit 305
- 9 Appleton St Unit 303
- 9 Appleton St Unit 302
- 9 Appleton St Unit 301
- 9 Appleton St Unit 300
- 9 Appleton St Unit 208
- 9 Appleton St Unit 207
- 9 Appleton St Unit 206
Your Personal Tour Guide
Ask me questions while you tour the home.