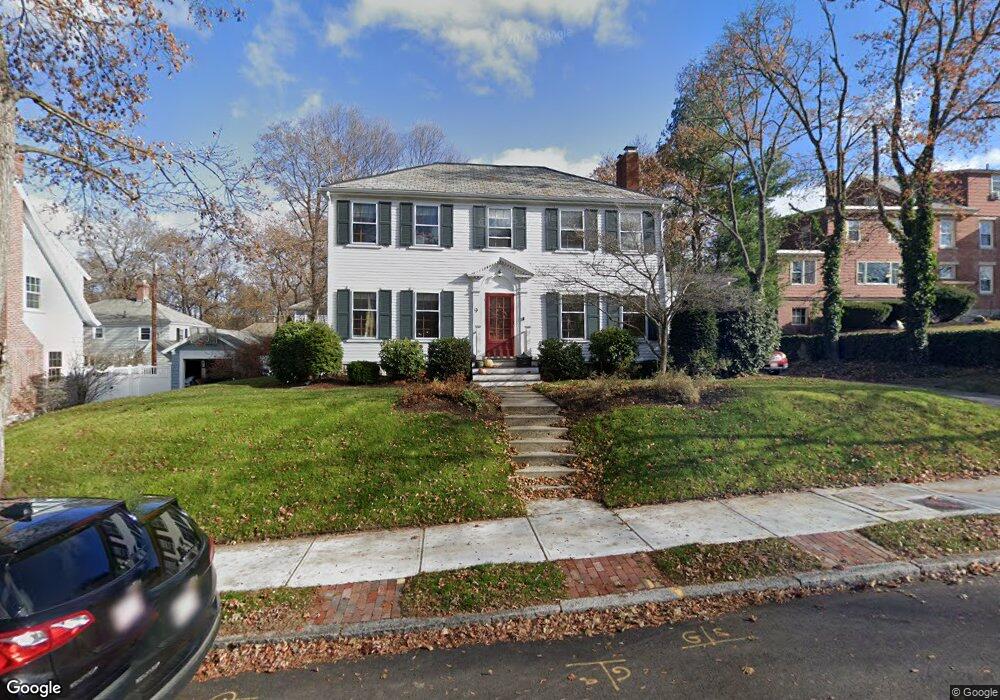
9 Argyle St Andover, MA 01810
Shawsheen Heights NeighborhoodEstimated Value: $965,000 - $1,053,337
4
Beds
3
Baths
2,301
Sq Ft
$436/Sq Ft
Est. Value
About This Home
This home is located at 9 Argyle St, Andover, MA 01810 and is currently estimated at $1,004,084, approximately $436 per square foot. 9 Argyle St is a home located in Essex County with nearby schools including West Elementary School, Andover West Middle School, and Andover High School.
Ownership History
Date
Name
Owned For
Owner Type
Purchase Details
Closed on
Jan 26, 2023
Sold by
Fournier Jonathan D and Coleman Julia L
Bought by
Coleman Fournier Ret and Fournier
Current Estimated Value
Purchase Details
Closed on
Nov 30, 2018
Sold by
Durland 3Rd William S and Durland Kathleen J
Bought by
Fournier Jonathan D and Coleman Julia L
Home Financials for this Owner
Home Financials are based on the most recent Mortgage that was taken out on this home.
Original Mortgage
$234,500
Interest Rate
4.8%
Mortgage Type
New Conventional
Purchase Details
Closed on
Oct 13, 1989
Sold by
Weidlein William
Bought by
Kuhn Phillip
Create a Home Valuation Report for This Property
The Home Valuation Report is an in-depth analysis detailing your home's value as well as a comparison with similar homes in the area
Home Values in the Area
Average Home Value in this Area
Purchase History
| Date | Buyer | Sale Price | Title Company |
|---|---|---|---|
| Coleman Fournier Ret | -- | None Available | |
| Coleman Fournier Ret | -- | None Available | |
| Fournier Jonathan D | $670,000 | -- | |
| Kuhn Phillip | $232,000 | -- | |
| Kuhn Phillip | $232,000 | -- |
Source: Public Records
Mortgage History
| Date | Status | Borrower | Loan Amount |
|---|---|---|---|
| Previous Owner | Fournier Jonathan D | $234,500 | |
| Previous Owner | Kuhn Phillip | $353,321 | |
| Previous Owner | Kuhn Phillip | $271,000 |
Source: Public Records
Tax History
| Year | Tax Paid | Tax Assessment Tax Assessment Total Assessment is a certain percentage of the fair market value that is determined by local assessors to be the total taxable value of land and additions on the property. | Land | Improvement |
|---|---|---|---|---|
| 2024 | $10,737 | $833,600 | $463,700 | $369,900 |
| 2023 | $10,255 | $750,700 | $417,700 | $333,000 |
| 2022 | $9,667 | $662,100 | $369,700 | $292,400 |
| 2021 | $9,231 | $603,700 | $336,100 | $267,600 |
| 2020 | $8,848 | $589,500 | $327,900 | $261,600 |
| 2019 | $8,716 | $570,800 | $315,100 | $255,700 |
| 2018 | $8,313 | $531,500 | $297,200 | $234,300 |
| 2017 | $7,947 | $523,500 | $291,300 | $232,200 |
| 2016 | $7,758 | $523,500 | $291,300 | $232,200 |
| 2015 | $7,463 | $498,500 | $280,200 | $218,300 |
Source: Public Records
Map
Nearby Homes
- 16 Balmoral St Unit 214
- 42 York St
- 50C Washington Park Dr Unit 10
- 28 Stirling St
- 181 High St Unit 1
- 1 Longwood Dr Unit 105
- 2 Powder Mill Square Unit 2B
- 30 Canterbury St
- 1 Sweeney Ct
- 5 Lewis St
- 102 Weare St
- 35 Peters St
- Lot 7 Weeping Willow Dr
- 21 Clubview Dr Unit 21
- 40 Chandler Cir
- 12B Stevens St
- 2 Kingston St Unit 2
- 33 Chestnut St Unit 2
- 25 Clubview Dr Unit 25
- 34 Leeds Terrace
Your Personal Tour Guide
Ask me questions while you tour the home.