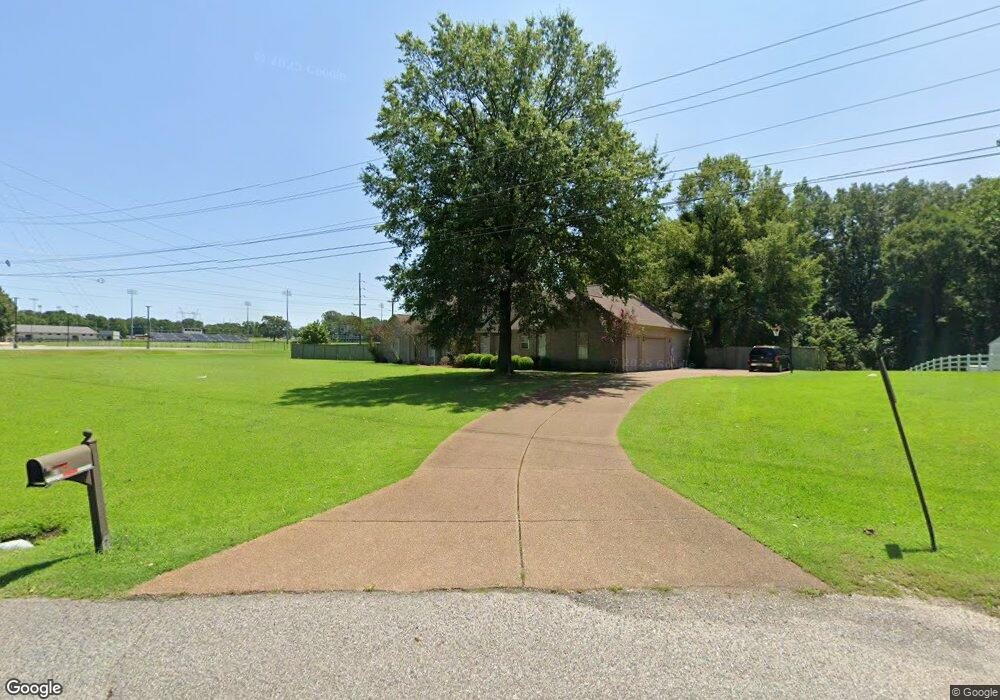
9 Bascom Rd Jackson, TN 38305
Estimated Value: $545,000 - $612,936
Studio
5
Baths
3,989
Sq Ft
$144/Sq Ft
Est. Value
About This Home
This home is located at 9 Bascom Rd, Jackson, TN 38305 and is currently estimated at $576,234, approximately $144 per square foot. 9 Bascom Rd is a home located in Madison County with nearby schools including Pope School, Northeast Middle School, and North Side High School.
Ownership History
Date
Name
Owned For
Owner Type
Purchase Details
Closed on
Sep 6, 2006
Sold by
Anderson Mark D
Bought by
Long Brandi L
Current Estimated Value
Home Financials for this Owner
Home Financials are based on the most recent Mortgage that was taken out on this home.
Original Mortgage
$246,320
Outstanding Balance
$144,248
Interest Rate
6.5%
Estimated Equity
$431,986
Purchase Details
Closed on
Jan 29, 1999
Bought by
Neisler Anthony Lane
Purchase Details
Closed on
Sep 20, 1993
Bought by
Winsett Bradford R
Purchase Details
Closed on
May 21, 1992
Bought by
Cooper Randy
Purchase Details
Closed on
Aug 23, 1988
Bought by
Lyons Billy J
Purchase Details
Closed on
Jan 22, 1954
Bought by
Matthews J S
Create a Home Valuation Report for This Property
The Home Valuation Report is an in-depth analysis detailing your home's value as well as a comparison with similar homes in the area
Purchase History
| Date | Buyer | Sale Price | Title Company |
|---|---|---|---|
| Long Brandi L | $307,900 | -- | |
| Neisler Anthony Lane | $18,000 | -- | |
| Winsett Bradford R | $18,000 | -- | |
| Cooper Randy | -- | -- | |
| Lyons Billy J | -- | -- | |
| Matthews J S | -- | -- |
Source: Public Records
Mortgage History
| Date | Status | Borrower | Loan Amount |
|---|---|---|---|
| Open | Matthews J S | $246,320 |
Source: Public Records
Tax History
| Year | Tax Paid | Tax Assessment Tax Assessment Total Assessment is a certain percentage of the fair market value that is determined by local assessors to be the total taxable value of land and additions on the property. | Land | Improvement |
|---|---|---|---|---|
| 2025 | $2,279 | $121,650 | $13,250 | $108,400 |
| 2024 | $2,279 | $121,650 | $13,250 | $108,400 |
| 2022 | $2,279 | $121,650 | $13,250 | $108,400 |
| 2021 | $2,241 | $95,350 | $10,775 | $84,575 |
| 2020 | $2,241 | $95,350 | $10,775 | $84,575 |
| 2019 | $2,241 | $95,350 | $10,775 | $84,575 |
| 2018 | $2,241 | $95,350 | $10,775 | $84,575 |
| 2017 | $2,203 | $89,925 | $10,775 | $79,150 |
| 2016 | $1,933 | $89,925 | $10,775 | $79,150 |
| 2015 | $1,933 | $89,925 | $10,775 | $79,150 |
| 2014 | $1,933 | $89,925 | $10,775 | $79,150 |
Source: Public Records
Map
Nearby Homes
- 231 Tuckahoe Rd
- 359 Old Bells Rd
- 119 Bascom Rd
- 23 Kinnewick Cove
- 80 Wrights Mill Dr
- 117 Tuckahoe Rd
- 52 Kinnewick Cove
- 135 Windy City Rd
- 11 Burning Tree Cove
- 129 Pepper Tree Rd
- 00 Windy City Rd
- 116 Ravenwood Dr
- 115 Buckingham Cove
- 43 Matthews Place Dr
- 52 Buckingham Cove
- 250 Bascom Rd
- 64 Swanbourne Cove
- 58 Swanbourne Cove
- 54 Laurelwood Cove
- 9 Citrus Springs Cove
- 19 Bascom Rd
- 00 Bascom Rd
- 439 Old Bells Rd
- 47 Bascom Rd
- 10 Windy City Rd
- 53 Bascom Rd
- 18 Windover Rd
- 22 Windover Rd
- 59 Bascom Rd
- 14 Windover Rd
- 21 Windover Rd
- 26 Windy City Rd
- 26 Windy City Rd
- 10 Windover Rd
- 65 Bascom Rd
- 19 Windover Rd
- 202 Tuckahoe Cove
- 104 Tuckahoe Rd
- 204 Tuckahoe Cove
- 102 Tuckahoe Rd
Your Personal Tour Guide
Ask me questions while you tour the home.