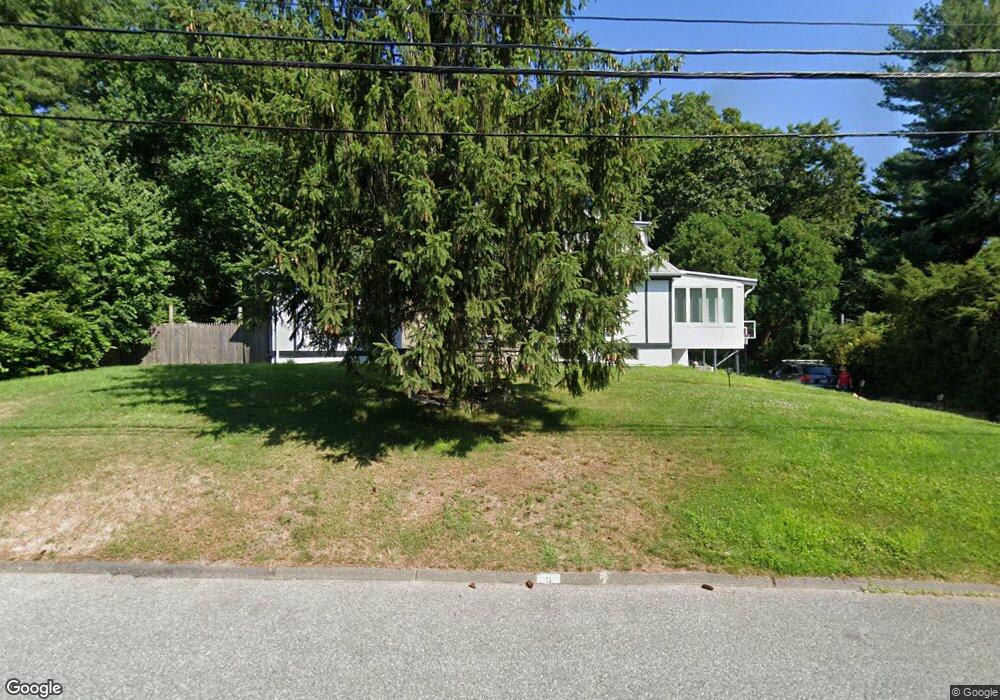
9 Belmore Rd Natick, MA 01760
Estimated Value: $992,130 - $1,084,000
3
Beds
3
Baths
2,534
Sq Ft
$413/Sq Ft
Est. Value
About This Home
This home is located at 9 Belmore Rd, Natick, MA 01760 and is currently estimated at $1,045,783, approximately $412 per square foot. 9 Belmore Rd is a home located in Middlesex County with nearby schools including Natick High School, J F Kennedy Middle School, and Brown Elementary School.
Ownership History
Date
Name
Owned For
Owner Type
Purchase Details
Closed on
Jul 30, 2001
Sold by
Rondiak Roman and Rondiak Ulana
Bought by
Robbins David S and Robbins Kristin M
Current Estimated Value
Home Financials for this Owner
Home Financials are based on the most recent Mortgage that was taken out on this home.
Original Mortgage
$399,750
Outstanding Balance
$156,274
Interest Rate
7.18%
Mortgage Type
Purchase Money Mortgage
Estimated Equity
$889,509
Create a Home Valuation Report for This Property
The Home Valuation Report is an in-depth analysis detailing your home's value as well as a comparison with similar homes in the area
Home Values in the Area
Average Home Value in this Area
Purchase History
| Date | Buyer | Sale Price | Title Company |
|---|---|---|---|
| Robbins David S | $421,500 | -- |
Source: Public Records
Mortgage History
| Date | Status | Borrower | Loan Amount |
|---|---|---|---|
| Open | Robbins David S | $399,750 |
Source: Public Records
Tax History Compared to Growth
Tax History
| Year | Tax Paid | Tax Assessment Tax Assessment Total Assessment is a certain percentage of the fair market value that is determined by local assessors to be the total taxable value of land and additions on the property. | Land | Improvement |
|---|---|---|---|---|
| 2025 | $8,813 | $736,900 | $426,400 | $310,500 |
| 2024 | $8,534 | $696,100 | $401,300 | $294,800 |
| 2023 | $8,359 | $661,300 | $386,100 | $275,200 |
| 2022 | $8,220 | $616,200 | $350,900 | $265,300 |
| 2021 | $7,888 | $579,600 | $330,900 | $248,700 |
| 2020 | $7,879 | $578,900 | $315,800 | $263,100 |
| 2019 | $6,128 | $578,900 | $315,800 | $263,100 |
| 2018 | $6,222 | $476,800 | $300,800 | $176,000 |
| 2017 | $5,944 | $440,600 | $256,000 | $184,600 |
| 2016 | $5,672 | $418,000 | $235,000 | $183,000 |
| 2015 | $5,576 | $403,500 | $235,000 | $168,500 |
Source: Public Records
Map
Nearby Homes
- 2 Lodge Rd
- 21 Kelsey Rd
- 38 Ranger Rd
- 91 Speen St
- 40 Silver Hill Ln Unit 4
- 32 Silver Hill Ln Unit 1
- 46 Silver Hill Ln Unit 1
- 4 Sylvia Ave
- 9 Silver Hill Ln Unit 19
- 8 Hartford St
- 6 Post Oak Ln Unit 10
- 24 Silver Hill Ln
- 11 Post Oak Ln Unit 6
- 12 Walden Dr Unit 19
- 57 Village Brook Ln Unit 5
- 50 Village Brook Ln Unit 4
- 20 Walden Dr Unit 16
- 36 Porter Rd
- 1 Fern St
- 293 Bacon St Unit A