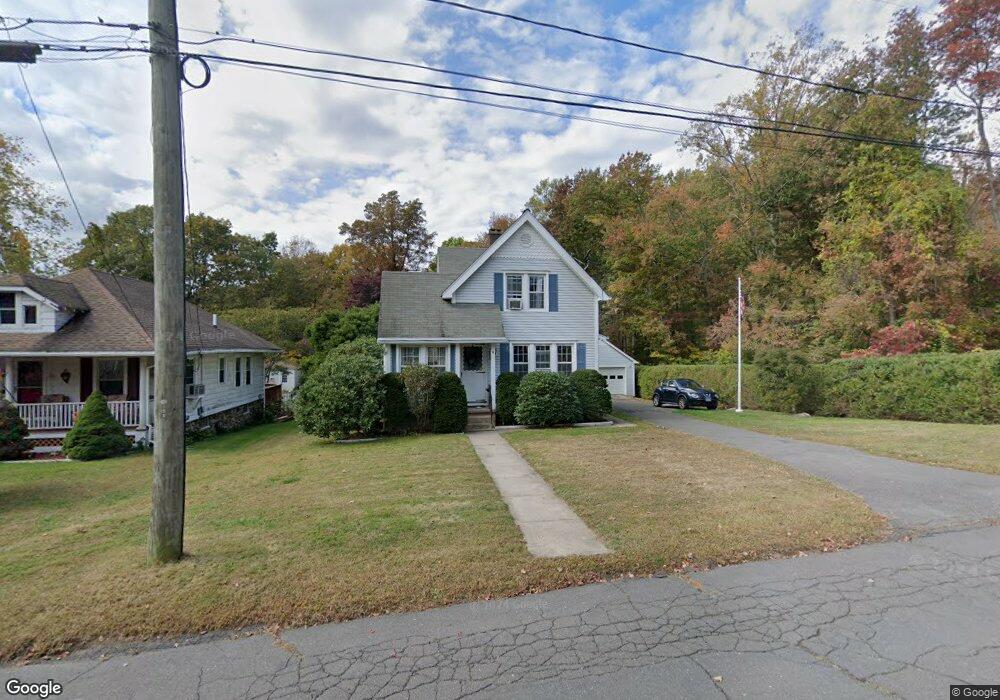
9 Bevin Blvd East Hampton, CT 06424
Estimated Value: $321,000 - $343,000
2
Beds
2
Baths
1,144
Sq Ft
$291/Sq Ft
Est. Value
About This Home
This home is located at 9 Bevin Blvd, East Hampton, CT 06424 and is currently estimated at $333,428, approximately $291 per square foot. 9 Bevin Blvd is a home located in Middlesex County with nearby schools including Memorial School, Center Elementary School, and East Hampton Middle School.
Ownership History
Date
Name
Owned For
Owner Type
Purchase Details
Closed on
Aug 28, 2020
Sold by
Smith Thomas R
Bought by
Dobson Shelley A
Current Estimated Value
Home Financials for this Owner
Home Financials are based on the most recent Mortgage that was taken out on this home.
Original Mortgage
$198,850
Outstanding Balance
$176,466
Interest Rate
2.9%
Mortgage Type
New Conventional
Estimated Equity
$156,962
Purchase Details
Closed on
May 2, 2011
Sold by
Wall Maryann and Belcourt Julie
Bought by
Smith Thomas R
Home Financials for this Owner
Home Financials are based on the most recent Mortgage that was taken out on this home.
Original Mortgage
$149,480
Interest Rate
4.87%
Mortgage Type
FHA
Create a Home Valuation Report for This Property
The Home Valuation Report is an in-depth analysis detailing your home's value as well as a comparison with similar homes in the area
Home Values in the Area
Average Home Value in this Area
Purchase History
| Date | Buyer | Sale Price | Title Company |
|---|---|---|---|
| Dobson Shelley A | $205,000 | None Available | |
| Dobson Shelley A | $205,000 | None Available | |
| Smith Thomas R | $165,000 | -- | |
| Smith Thomas R | $165,000 | -- |
Source: Public Records
Mortgage History
| Date | Status | Borrower | Loan Amount |
|---|---|---|---|
| Open | Dobson Shelley A | $198,850 | |
| Closed | Dobson Shelley A | $198,850 | |
| Previous Owner | Smith Thomas R | $146,700 | |
| Previous Owner | Smith Thomas R | $149,480 |
Source: Public Records
Tax History Compared to Growth
Tax History
| Year | Tax Paid | Tax Assessment Tax Assessment Total Assessment is a certain percentage of the fair market value that is determined by local assessors to be the total taxable value of land and additions on the property. | Land | Improvement |
|---|---|---|---|---|
| 2025 | $4,739 | $119,330 | $38,860 | $80,470 |
| 2024 | $4,539 | $119,330 | $38,860 | $80,470 |
| 2023 | $4,303 | $119,330 | $38,860 | $80,470 |
| 2022 | $4,136 | $119,330 | $38,860 | $80,470 |
| 2021 | $4,120 | $119,330 | $38,860 | $80,470 |
| 2020 | $4,038 | $121,860 | $39,590 | $82,270 |
| 2019 | $4,156 | $125,410 | $40,700 | $84,710 |
| 2018 | $3,928 | $125,410 | $40,700 | $84,710 |
| 2017 | $3,928 | $125,410 | $40,700 | $84,710 |
| 2016 | $3,692 | $125,410 | $40,700 | $84,710 |
| 2015 | $3,476 | $125,140 | $39,180 | $85,960 |
| 2014 | $3,025 | $125,140 | $39,180 | $85,960 |
Source: Public Records
Map
Nearby Homes
- 1 Watrous St
- 4 Watrous St
- 14 Main St
- 29 Watrous St
- 10 Railroad Ave
- 6 Lakeview St
- 8 Wells Ave
- 15 Chatham Fields Rd
- 24 Hills Ave
- 23 Edgerton St
- Homesite 10 Quinns Way
- 152 Main St
- 48 Flanders Rd
- Homesite 4 Quinns Way
- 43 Oneill Ln
- 708 Lake Vista Dr Unit 708
- 76 Skinner St
- 75 N Main St
- 36 Champion Hill Rd
- 123 W High St