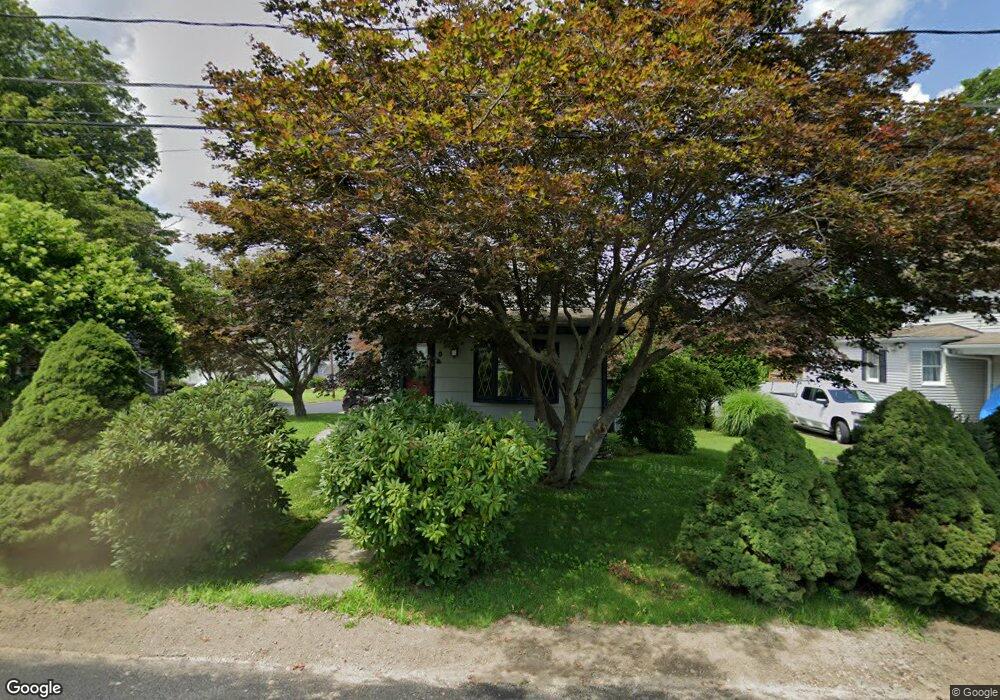
9 Blaine St Danbury, CT 06810
Estimated Value: $425,615 - $482,000
4
Beds
2
Baths
1,614
Sq Ft
$280/Sq Ft
Est. Value
About This Home
This home is located at 9 Blaine St, Danbury, CT 06810 and is currently estimated at $452,154, approximately $280 per square foot. 9 Blaine St is a home located in Fairfield County with nearby schools including Morris Street Elementary School, Rogers Park Middle School, and Danbury High School.
Ownership History
Date
Name
Owned For
Owner Type
Purchase Details
Closed on
Jun 11, 2024
Sold by
Grenier Erna Est and Grenier
Bought by
Jimenez Tania and Jimenez Claudio A
Current Estimated Value
Home Financials for this Owner
Home Financials are based on the most recent Mortgage that was taken out on this home.
Original Mortgage
$320,000
Outstanding Balance
$316,070
Interest Rate
7.22%
Mortgage Type
Purchase Money Mortgage
Estimated Equity
$136,084
Purchase Details
Closed on
Jun 17, 1977
Bought by
Grenier Vianney R and Grenier Erna M
Create a Home Valuation Report for This Property
The Home Valuation Report is an in-depth analysis detailing your home's value as well as a comparison with similar homes in the area
Home Values in the Area
Average Home Value in this Area
Purchase History
| Date | Buyer | Sale Price | Title Company |
|---|---|---|---|
| Jimenez Tania | $400,000 | None Available | |
| Jimenez Tania | $400,000 | None Available | |
| Grenier Vianney R | $18,000 | -- |
Source: Public Records
Mortgage History
| Date | Status | Borrower | Loan Amount |
|---|---|---|---|
| Open | Jimenez Tania | $320,000 | |
| Closed | Jimenez Tania | $320,000 |
Source: Public Records
Tax History Compared to Growth
Tax History
| Year | Tax Paid | Tax Assessment Tax Assessment Total Assessment is a certain percentage of the fair market value that is determined by local assessors to be the total taxable value of land and additions on the property. | Land | Improvement |
|---|---|---|---|---|
| 2025 | $5,332 | $213,360 | $61,460 | $151,900 |
| 2024 | $5,215 | $213,360 | $61,460 | $151,900 |
| 2023 | $4,978 | $213,360 | $61,460 | $151,900 |
| 2022 | $4,507 | $159,700 | $64,700 | $95,000 |
| 2021 | $4,408 | $159,700 | $64,700 | $95,000 |
| 2020 | $4,408 | $159,700 | $64,700 | $95,000 |
| 2019 | $4,408 | $159,700 | $64,700 | $95,000 |
| 2018 | $4,408 | $159,700 | $64,700 | $95,000 |
| 2017 | $4,076 | $140,800 | $61,600 | $79,200 |
| 2016 | $4,038 | $140,800 | $61,600 | $79,200 |
| 2015 | $3,979 | $140,800 | $61,600 | $79,200 |
| 2014 | $3,886 | $140,800 | $61,600 | $79,200 |
Source: Public Records
Map
Nearby Homes