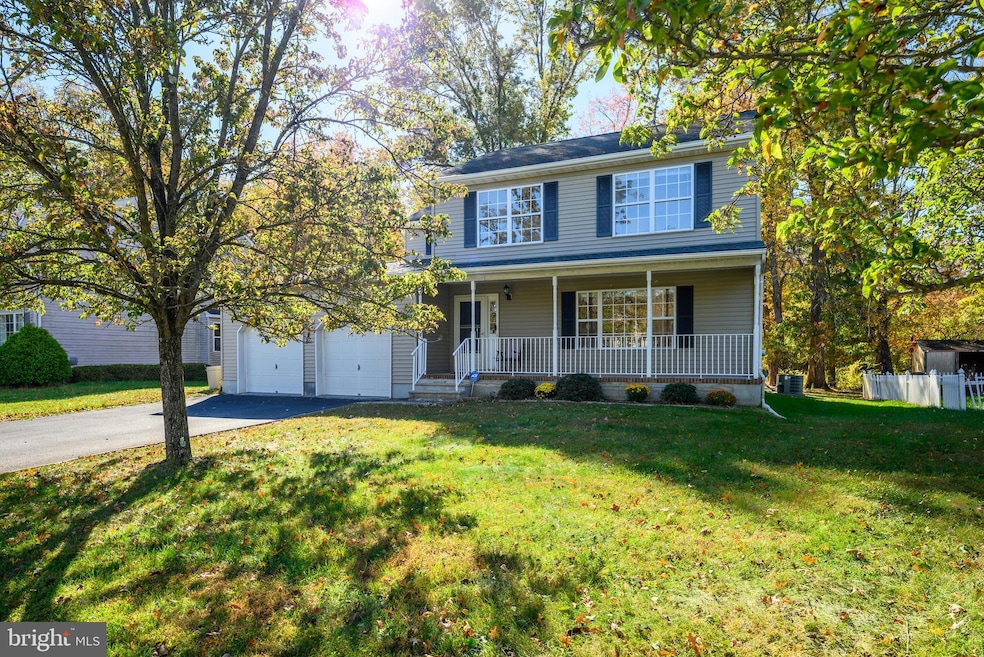

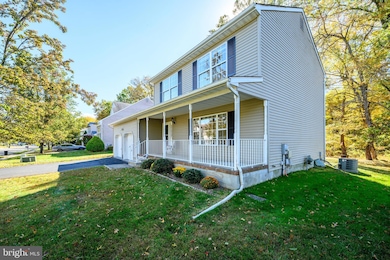
9 Blossom Dr Ewing, NJ 08638
Braeburn Heights NeighborhoodEstimated payment $3,706/month
Highlights
- Very Popular Property
- Colonial Architecture
- Attic
- View of Trees or Woods
- Deck
- Family Room Off Kitchen
About This Home
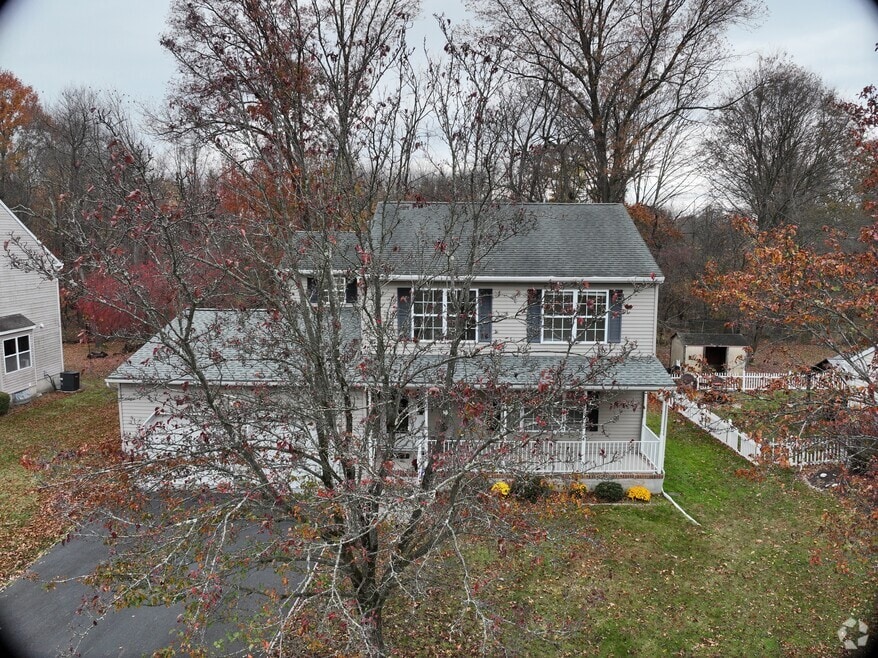
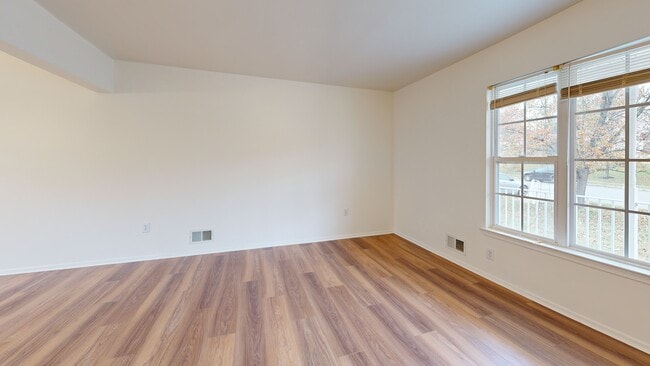
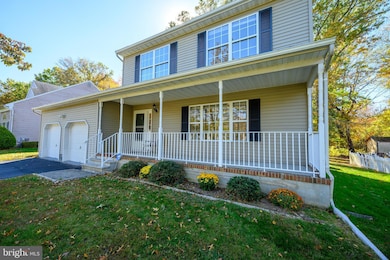
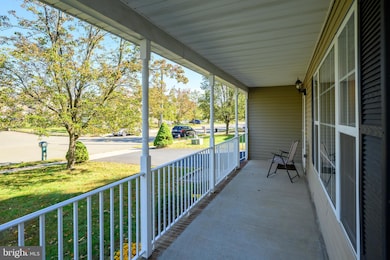
Welcome to this immaculate, freshly painted, 4-Bedroom, 2.5 bath single-family Ewing Township Colonial home in the desirable Spring Meadow Estates Community! Just 3 minutes to The College of New Jersey (TCNJ). Step inside this bright and sunny house to discover brand-new wood laminate flooring throughout the spacious first floor, which includes an eat-in kitchen, dining room, and large living room, with plush carpeting upstairs for ultimate comfort in the bedroom areas. There is plenty of living space for the family and guests. Freshly painted from top to bottom, including in the two-car garage, this home is clean as a whistle and move-in ready. The inviting family room, with recessed lighting, features sliding doors that open onto a freshly painted deck overlooking tranquil wooded views—an ideal spot for relaxing or entertaining guests. The property backs up to woods, offering privacy and a picturesque natural setting. One of the best features of this home is that every window in the back of the house (dining room, kitchen, family room, bathrooms, and two bedrooms) looks out onto the woods as a peaceful and quiet setting. Additional highlights include: a large front porch, a full basement with a washer, dryer, and dehumidifier, as well as ample space for storage or future expansion. The primary bedroom features a private bath and two closets, including a walk-in closet. A new roof was added to the lower portion of the house (garage, family room, and porch). There is also a newer AC compressor unit and a newer gas water heater. Enjoy the perfect blend of peaceful suburban living with easy access to shopping, dining, schools, universities, hospitals, and commuter routes (minutes to Princeton, Princeton Junction, and Hamilton stations to connect you with greater New York City, as well as the West Trenton line to connect you with greater Philadelphia). Don’t miss the opportunity to own this lovingly maintained colonial—schedule a tour today!
Listing Agent
(609) 213-6427 cmwinka@gmail.com Coldwell Banker Residential Brokerage - Princeton Listed on: 10/24/2025

Home Details
Home Type
- Single Family
Est. Annual Taxes
- $10,593
Year Built
- Built in 2000
Lot Details
- 7,950 Sq Ft Lot
- Property is in very good condition
HOA Fees
- $29 Monthly HOA Fees
Parking
- 2 Car Attached Garage
- 2 Driveway Spaces
- Front Facing Garage
- Garage Door Opener
Home Design
- Colonial Architecture
- Pitched Roof
- Aluminum Siding
- Concrete Perimeter Foundation
Interior Spaces
- 1,861 Sq Ft Home
- Property has 2 Levels
- Recessed Lighting
- Family Room Off Kitchen
- Living Room
- Dining Room
- Views of Woods
- Home Security System
- Attic
Kitchen
- Eat-In Kitchen
- Built-In Range
- Range Hood
- Dishwasher
Flooring
- Carpet
- Laminate
Bedrooms and Bathrooms
- 4 Bedrooms
- En-Suite Bathroom
- Walk-In Closet
- Bathtub with Shower
Laundry
- Washer
- Gas Dryer
Unfinished Basement
- Basement Fills Entire Space Under The House
- Laundry in Basement
Outdoor Features
- Deck
- Exterior Lighting
Schools
- William L. Antheil Elementary School
- Fisher Mid Middle School
- Ewing High School
Utilities
- Forced Air Heating and Cooling System
- Cooling System Utilizes Natural Gas
- Vented Exhaust Fan
- Underground Utilities
- 150 Amp Service
- Natural Gas Water Heater
Community Details
- Association fees include common area maintenance
- Spring Meadow HOA
- Spring Meadow Subdivision, Adams Floorplan
Listing and Financial Details
- Tax Lot 00003
- Assessor Parcel Number 02-00193 05-00003
3D Interior and Exterior Tours
Floorplans
Map
Home Values in the Area
Average Home Value in this Area
Tax History
| Year | Tax Paid | Tax Assessment Tax Assessment Total Assessment is a certain percentage of the fair market value that is determined by local assessors to be the total taxable value of land and additions on the property. | Land | Improvement |
|---|---|---|---|---|
| 2025 | $10,285 | $261,500 | $85,300 | $176,200 |
| 2024 | $9,668 | $261,500 | $85,300 | $176,200 |
| 2023 | $9,668 | $261,500 | $85,300 | $176,200 |
| 2022 | $9,406 | $261,500 | $85,300 | $176,200 |
| 2021 | $9,176 | $261,500 | $85,300 | $176,200 |
| 2020 | $9,045 | $261,500 | $85,300 | $176,200 |
| 2019 | $8,810 | $261,500 | $85,300 | $176,200 |
| 2018 | $8,462 | $160,200 | $39,100 | $121,100 |
| 2017 | $8,659 | $160,200 | $39,100 | $121,100 |
| 2016 | $8,542 | $160,200 | $39,100 | $121,100 |
| 2015 | $8,428 | $160,200 | $39,100 | $121,100 |
| 2014 | $8,406 | $160,200 | $39,100 | $121,100 |
Property History
| Date | Event | Price | List to Sale | Price per Sq Ft |
|---|---|---|---|---|
| 10/24/2025 10/24/25 | For Sale | $530,000 | -- | $285 / Sq Ft |
Purchase History
| Date | Type | Sale Price | Title Company |
|---|---|---|---|
| Deed | $328,000 | -- | |
| Deed | $189,900 | -- |
Mortgage History
| Date | Status | Loan Amount | Loan Type |
|---|---|---|---|
| Open | $229,600 | Purchase Money Mortgage | |
| Previous Owner | $188,344 | FHA |
About the Listing Agent
30+ year resident of Mercer County
20+ years of experience in the real estate industry. I was licensed in 2004, and before that time, I was a legal assistant to a real estate attorney.
My client's needs always come first. I provide quality service and enjoy helping clients achieve their goals of home ownership. I am extremely organized and will provide patience and
guidance throughout the entire process.
Coldwell Banker provides me with state-of-the-art technology. All of
Source: Bright MLS
MLS Number: NJME2067670
APN: 02-00193-05-00003
Disclaimer: Certain information contained herein is derived from information provided by parties other than Homes.com. All information provided is deemed reliable, but is not guaranteed to be accurate and should be independently verified.
![]() The data relating to real estate for sale on this website appears in part through the BRIGHT Internet Data Exchange program, a voluntary cooperative exchange of property listing data between licensed real estate brokerage firms, and is provided by BRIGHT through a licensing agreement.
The data relating to real estate for sale on this website appears in part through the BRIGHT Internet Data Exchange program, a voluntary cooperative exchange of property listing data between licensed real estate brokerage firms, and is provided by BRIGHT through a licensing agreement.
Listing information is from various brokers who participate in the Bright MLS IDX program and not all listings may be visible on the site.
The property information being provided on or through the website is for the personal, non-commercial use of consumers and such information may not be used for any purpose other than to identify prospective properties consumers may be interested in purchasing.
Some properties which appear for sale on the website may no longer be available because they are for instance, under contract, sold or are no longer being offered for sale.
Property information displayed is deemed reliable but is not guaranteed.
Copyright 2025 Bright MLS, Inc.
- 4 Blossom Dr
- 38 Running Brook Rd
- 256 Ewingville Rd
- 200 Claflin Ave
- 200 Upland Ave
- 186 Upland Ave
- 188 Browning Ave
- 41 Poland St
- 140 Crescent Ave
- 117 Browning Ave
- 7 Mabel St
- 120 Sussex St
- 137 Ardsley Ave
- 56 Holiday Ct
- 194 Woodland Ave
- 6 Holiday Ct
- 8 Misty Morn Ln
- 107 Hawthorne Ave
- 14 Chesney Ave
- 121 Oregon Ave
- 39 Mabel St
- 135 Keswick Ave
- 1501 Parkside Ave
- 56 Sherbrooke Rd
- 350 Windsor Ct
- 1475 Parkside Ave
- 438 Ewingville Rd
- 1480 Parkside Ave
- 8 Ewington Ave Unit 1
- 34 Western Ave
- 1000 Stewarts Crossing Way
- 10 Morse Ave
- 16 Eldridge Ave
- 19 Pershing Ave Unit 3 - Fully Furnished
- 1 Highgate Dr
- 107 Meadow Woods Ln
- 211 Meadow Woods Ln Unit 211
- 312 Meadow Woods Ln
- 112 Hazelhurst Ave
- 1075 Fireside Ave