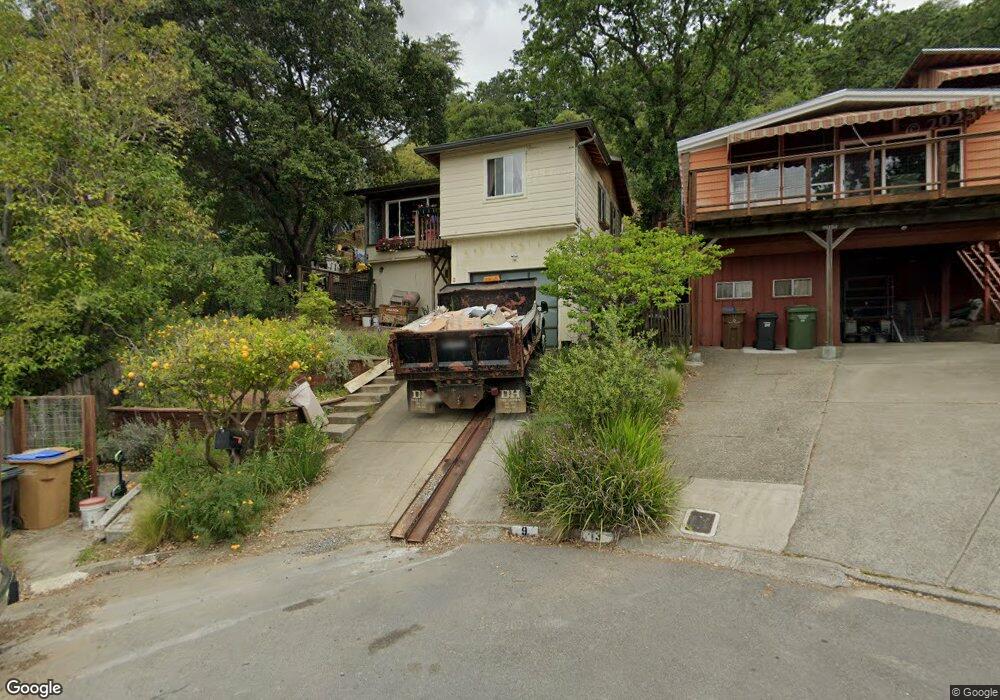
9 Brookside Ct San Anselmo, CA 94960
Estimated Value: $924,000 - $1,050,000
2
Beds
1
Bath
756
Sq Ft
$1,301/Sq Ft
Est. Value
About This Home
This home is located at 9 Brookside Ct, San Anselmo, CA 94960 and is currently estimated at $983,426, approximately $1,300 per square foot. 9 Brookside Ct is a home located in Marin County with nearby schools including Brookside Elementary School, White Hill Middle School, and Archie Williams High School.
Ownership History
Date
Name
Owned For
Owner Type
Purchase Details
Closed on
Jul 21, 2014
Sold by
Moncayo Michael and Moncayo Karen
Bought by
Iojica Vlad and Iojica Diana P
Current Estimated Value
Home Financials for this Owner
Home Financials are based on the most recent Mortgage that was taken out on this home.
Original Mortgage
$494,505
Outstanding Balance
$370,792
Interest Rate
3.75%
Mortgage Type
FHA
Estimated Equity
$612,634
Purchase Details
Closed on
Nov 16, 2006
Sold by
Rothert Lucille V
Bought by
Moncayo Michael and Moncayo Karen
Home Financials for this Owner
Home Financials are based on the most recent Mortgage that was taken out on this home.
Original Mortgage
$153,000
Interest Rate
6.38%
Mortgage Type
Stand Alone Second
Purchase Details
Closed on
Oct 31, 1995
Sold by
Scanlan Alice E
Bought by
Dolan Alice E
Create a Home Valuation Report for This Property
The Home Valuation Report is an in-depth analysis detailing your home's value as well as a comparison with similar homes in the area
Home Values in the Area
Average Home Value in this Area
Purchase History
| Date | Buyer | Sale Price | Title Company |
|---|---|---|---|
| Iojica Vlad | $540,000 | Stewart Title Of Ca Inc | |
| Moncayo Michael | $570,000 | Fidelity National Title Co | |
| Dolan Alice E | -- | -- |
Source: Public Records
Mortgage History
| Date | Status | Borrower | Loan Amount |
|---|---|---|---|
| Open | Iojica Vlad | $494,505 | |
| Previous Owner | Moncayo Michael | $153,000 | |
| Previous Owner | Moncayo Michael | $417,000 |
Source: Public Records
Tax History Compared to Growth
Tax History
| Year | Tax Paid | Tax Assessment Tax Assessment Total Assessment is a certain percentage of the fair market value that is determined by local assessors to be the total taxable value of land and additions on the property. | Land | Improvement |
|---|---|---|---|---|
| 2025 | $10,840 | $773,976 | $558,841 | $215,135 |
| 2024 | $10,840 | $676,254 | $547,886 | $128,368 |
| 2023 | $10,276 | $623,780 | $537,144 | $86,636 |
| 2022 | $10,134 | $611,549 | $526,612 | $84,937 |
| 2021 | $9,923 | $599,561 | $516,289 | $83,272 |
| 2020 | $9,785 | $593,416 | $510,997 | $82,419 |
| 2019 | $9,590 | $581,784 | $500,981 | $80,803 |
| 2018 | $9,182 | $570,379 | $491,160 | $79,219 |
| 2017 | $8,978 | $559,196 | $481,530 | $77,666 |
| 2016 | $8,565 | $548,234 | $472,091 | $76,143 |
| 2015 | $8,502 | $540,000 | $465,000 | $75,000 |
| 2014 | $9,200 | $622,957 | $524,596 | $98,361 |
Source: Public Records
Map
Nearby Homes
- 11 Brookside Dr
- 20 Brookmont Cir
- 1 Aspen Ct
- 135 Morningside Dr
- 6 Kilgore Ln
- 134 San Francisco Blvd
- 99 Alder Ave
- 1508 San Anselmo Ave
- 95 Florence Ave
- 272 Los Angeles Blvd
- 2 Hillcrest Ct
- 211 The Alameda
- 43 Creek Rd
- 7 Belmont Ave
- 0 Valley Rd Unit 325089584
- 91 Holstein Rd
- 103 Holstein Rd
- 53 Foothill Rd
- 405 Scenic Ave
- 71 Live Oak Ave