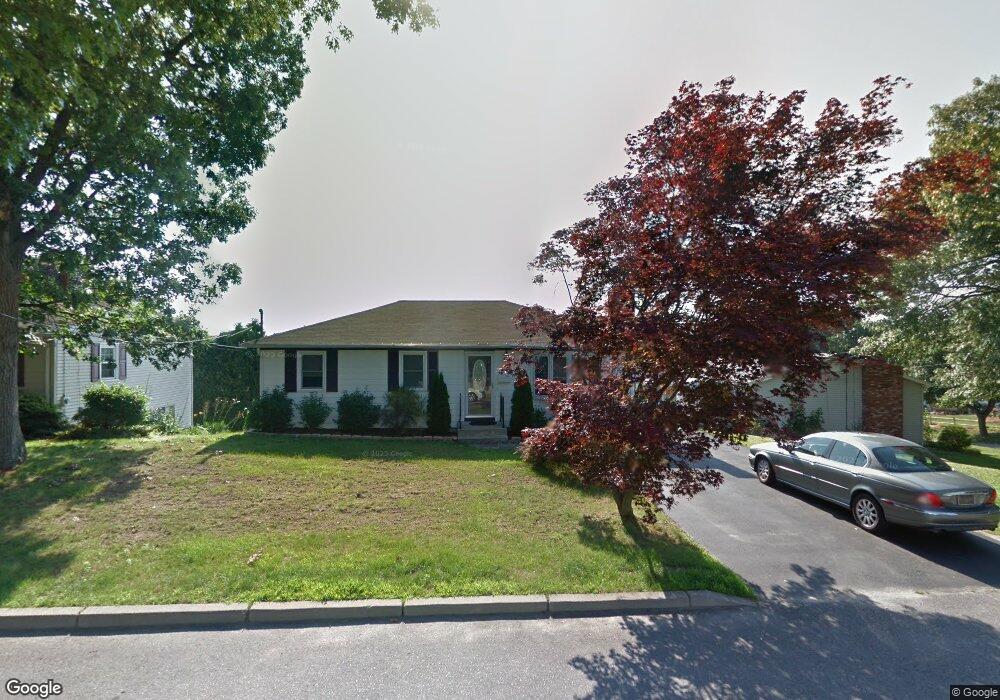
9 Burr St Cranston, RI 02920
Budlong NeighborhoodEstimated Value: $442,074 - $482,000
4
Beds
2
Baths
1,820
Sq Ft
$251/Sq Ft
Est. Value
About This Home
This home is located at 9 Burr St, Cranston, RI 02920 and is currently estimated at $457,269, approximately $251 per square foot. 9 Burr St is a home located in Providence County with nearby schools including Woodridge Elementary School, Western Hills Middle School, and Cranston High School West.
Ownership History
Date
Name
Owned For
Owner Type
Purchase Details
Closed on
Apr 16, 2009
Sold by
Bisignano Frances J and Cirllo Cheryl A
Bought by
Cimini Joseph N
Current Estimated Value
Home Financials for this Owner
Home Financials are based on the most recent Mortgage that was taken out on this home.
Original Mortgage
$173,655
Outstanding Balance
$109,775
Interest Rate
5.02%
Mortgage Type
VA
Estimated Equity
$347,494
Purchase Details
Closed on
Dec 30, 1998
Sold by
Cirillo Michael D and Cirillo Cheryl
Bought by
Cirillo Michael and Cirillo Almerinda
Create a Home Valuation Report for This Property
The Home Valuation Report is an in-depth analysis detailing your home's value as well as a comparison with similar homes in the area
Home Values in the Area
Average Home Value in this Area
Purchase History
| Date | Buyer | Sale Price | Title Company |
|---|---|---|---|
| Cimini Joseph N | $170,000 | -- | |
| Cirillo Michael | $118,500 | -- |
Source: Public Records
Mortgage History
| Date | Status | Borrower | Loan Amount |
|---|---|---|---|
| Open | Cirillo Michael | $173,655 | |
| Previous Owner | Cirillo Michael | $268,000 | |
| Previous Owner | Cirillo Michael | $30,000 | |
| Previous Owner | Cirillo Michael | $180,000 |
Source: Public Records
Tax History Compared to Growth
Tax History
| Year | Tax Paid | Tax Assessment Tax Assessment Total Assessment is a certain percentage of the fair market value that is determined by local assessors to be the total taxable value of land and additions on the property. | Land | Improvement |
|---|---|---|---|---|
| 2025 | $4,980 | $358,800 | $108,800 | $250,000 |
| 2024 | $4,883 | $358,800 | $108,800 | $250,000 |
| 2023 | $4,665 | $246,800 | $71,700 | $175,100 |
| 2022 | $4,568 | $246,800 | $71,700 | $175,100 |
| 2021 | $4,442 | $246,800 | $71,700 | $175,100 |
| 2020 | $4,179 | $201,200 | $68,200 | $133,000 |
| 2019 | $4,179 | $201,200 | $68,200 | $133,000 |
| 2018 | $4,082 | $201,200 | $68,200 | $133,000 |
| 2017 | $3,998 | $174,300 | $61,400 | $112,900 |
| 2016 | $3,913 | $174,300 | $61,400 | $112,900 |
| 2015 | $3,913 | $174,300 | $61,400 | $112,900 |
| 2014 | $3,963 | $173,500 | $61,400 | $112,100 |
Source: Public Records
Map
Nearby Homes