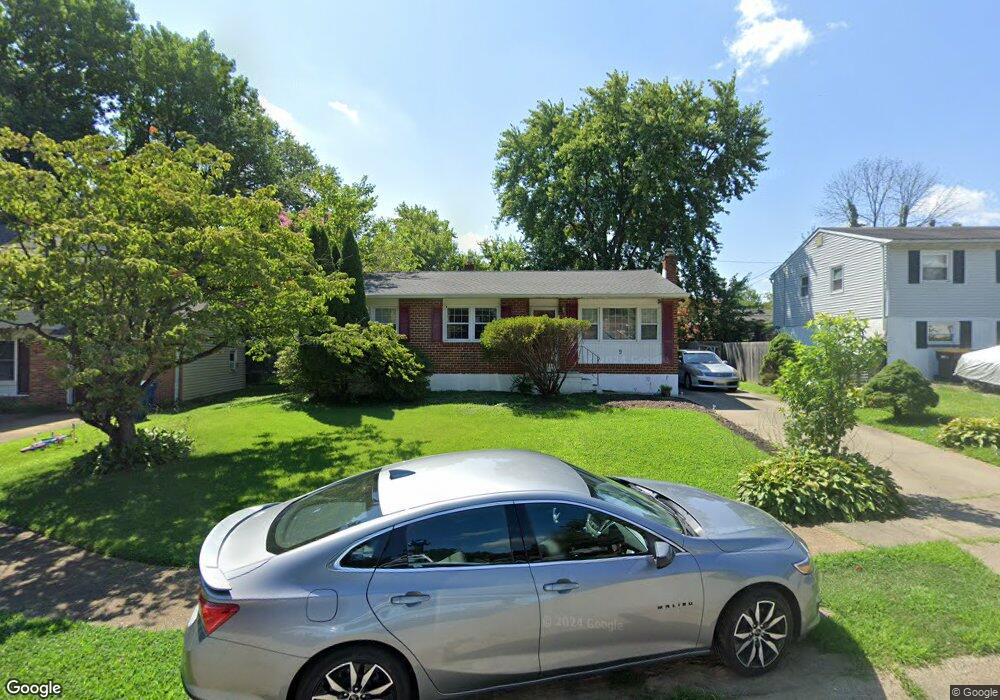
9 Carnegie Ct Newark, DE 19713
Estimated Value: $339,000 - $418,000
3
Beds
2
Baths
1,088
Sq Ft
$340/Sq Ft
Est. Value
About This Home
This home is located at 9 Carnegie Ct, Newark, DE 19713 and is currently estimated at $369,902, approximately $339 per square foot. 9 Carnegie Ct is a home located in New Castle County with nearby schools including Brookside Elementary School, Shue-Medill Middle School, and Newark High School.
Ownership History
Date
Name
Owned For
Owner Type
Purchase Details
Closed on
Oct 21, 2021
Sold by
Gatling Irvin N
Bought by
Gatling Irvin N
Current Estimated Value
Home Financials for this Owner
Home Financials are based on the most recent Mortgage that was taken out on this home.
Original Mortgage
$203,500
Interest Rate
2.88%
Mortgage Type
FHA
Purchase Details
Closed on
Sep 25, 2011
Bought by
Gatling Irvin N
Purchase Details
Closed on
Nov 30, 2004
Sold by
Welch Sanders and Welch Cynthia
Bought by
Gatling Irvin N and Gatling Lydia M
Home Financials for this Owner
Home Financials are based on the most recent Mortgage that was taken out on this home.
Original Mortgage
$159,920
Interest Rate
6.62%
Mortgage Type
Purchase Money Mortgage
Create a Home Valuation Report for This Property
The Home Valuation Report is an in-depth analysis detailing your home's value as well as a comparison with similar homes in the area
Home Values in the Area
Average Home Value in this Area
Purchase History
| Date | Buyer | Sale Price | Title Company |
|---|---|---|---|
| Gatling Irvin N | -- | None Listed On Document | |
| Gatling Irvin N | $199,900 | -- | |
| Gatling Irvin N | $199,900 | Old Republic National Title |
Source: Public Records
Mortgage History
| Date | Status | Borrower | Loan Amount |
|---|---|---|---|
| Previous Owner | Gatling Irvin N | $203,500 | |
| Previous Owner | Gatling Irvin N | $159,920 | |
| Closed | Gatling Irvin N | $39,980 |
Source: Public Records
Tax History
| Year | Tax Paid | Tax Assessment Tax Assessment Total Assessment is a certain percentage of the fair market value that is determined by local assessors to be the total taxable value of land and additions on the property. | Land | Improvement |
|---|---|---|---|---|
| 2024 | $2,146 | $50,400 | $6,300 | $44,100 |
| 2023 | $2,087 | $50,400 | $6,300 | $44,100 |
| 2022 | $2,082 | $50,400 | $6,300 | $44,100 |
| 2021 | $2,039 | $50,400 | $6,300 | $44,100 |
| 2020 | $1,986 | $50,400 | $6,300 | $44,100 |
| 2019 | $1,973 | $50,400 | $6,300 | $44,100 |
| 2018 | $1,709 | $50,400 | $6,300 | $44,100 |
| 2017 | $1,648 | $50,400 | $6,300 | $44,100 |
| 2016 | $1,644 | $50,400 | $6,300 | $44,100 |
| 2015 | $1,498 | $50,400 | $6,300 | $44,100 |
| 2014 | $1,497 | $50,400 | $6,300 | $44,100 |
Source: Public Records
Map
Nearby Homes
- 11 Carnegie Ct
- 511 Lisbeth Rd
- 511 Shue Dr
- 6 Fleming St
- 3 Merry Rd
- 619 Shue Dr
- 620 Ilse Dr
- 42 Lynch Farm Dr
- 119 Felix Dr
- 3 Marlyn Rd
- 1000 Fountainview Cir Unit 309
- 3000 Fountainview Cir Unit 3411
- 600 Judy Way
- 17 Pearson Dr
- 47 Carole Rd
- 18 Malvina Ln
- 402 Stafford Ave
- 26 Kensington Ln
- 221 S Dillwyn Rd
- 21 Merion Rd
Your Personal Tour Guide
Ask me questions while you tour the home.