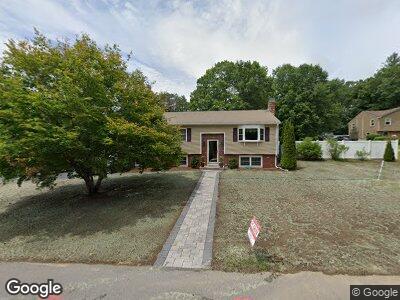
9 Carriage Dr Auburn, MA 01501
Pondville NeighborhoodEstimated Value: $498,994 - $563,000
3
Beds
2
Baths
1,868
Sq Ft
$286/Sq Ft
Est. Value
About This Home
This home is located at 9 Carriage Dr, Auburn, MA 01501 and is currently estimated at $534,499, approximately $286 per square foot. 9 Carriage Dr is a home located in Worcester County with nearby schools including Auburn Senior High School and Shrewsbury Montessori School - Auburn Campus.
Ownership History
Date
Name
Owned For
Owner Type
Purchase Details
Closed on
May 30, 2008
Sold by
Mcnamara Catherine M and Mcnamara James M
Bought by
Shea Jennifer A
Current Estimated Value
Home Financials for this Owner
Home Financials are based on the most recent Mortgage that was taken out on this home.
Original Mortgage
$223,000
Interest Rate
5.91%
Mortgage Type
Purchase Money Mortgage
Create a Home Valuation Report for This Property
The Home Valuation Report is an in-depth analysis detailing your home's value as well as a comparison with similar homes in the area
Home Values in the Area
Average Home Value in this Area
Purchase History
| Date | Buyer | Sale Price | Title Company |
|---|---|---|---|
| Shea Jennifer A | $279,000 | -- |
Source: Public Records
Mortgage History
| Date | Status | Borrower | Loan Amount |
|---|---|---|---|
| Open | Matthew Jennifer A | $170,000 | |
| Closed | Matthew Jennifer A | $50,000 | |
| Closed | Matthew Jennifer A | $36,000 | |
| Closed | Matthew Jennifer A | $201,600 | |
| Closed | Mcnamara James M | $223,200 | |
| Closed | Shea Jennifer A | $223,000 | |
| Previous Owner | Mcnamara Catherine M | $336,000 | |
| Previous Owner | Mcnamara James M | $100,000 | |
| Previous Owner | Mcnamara James M | $53,000 |
Source: Public Records
Tax History Compared to Growth
Tax History
| Year | Tax Paid | Tax Assessment Tax Assessment Total Assessment is a certain percentage of the fair market value that is determined by local assessors to be the total taxable value of land and additions on the property. | Land | Improvement |
|---|---|---|---|---|
| 2025 | $66 | $462,400 | $124,200 | $338,200 |
| 2024 | $6,554 | $439,000 | $119,400 | $319,600 |
| 2023 | $6,255 | $393,900 | $108,600 | $285,300 |
| 2022 | $5,921 | $352,000 | $108,600 | $243,400 |
| 2021 | $189 | $316,400 | $96,500 | $219,900 |
| 2020 | $14,008 | $316,400 | $96,500 | $219,900 |
| 2019 | $5,554 | $301,500 | $95,000 | $206,500 |
| 2018 | $5,366 | $291,000 | $88,900 | $202,100 |
| 2017 | $5,110 | $278,600 | $80,500 | $198,100 |
| 2016 | $4,987 | $275,700 | $83,100 | $192,600 |
| 2015 | $4,574 | $265,000 | $83,100 | $181,900 |
| 2014 | $4,397 | $254,300 | $79,200 | $175,100 |
Source: Public Records
Map
Nearby Homes