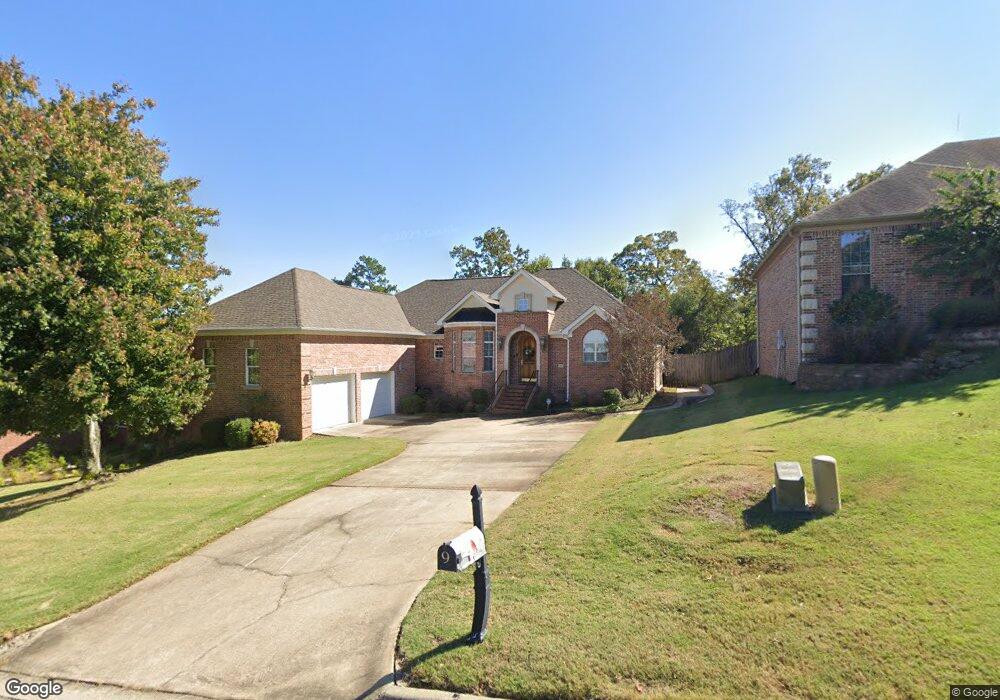
9 Chalamont Way Little Rock, AR 72223
Chenal Valley NeighborhoodEstimated Value: $434,656 - $490,000
--
Bed
4
Baths
2,860
Sq Ft
$163/Sq Ft
Est. Value
About This Home
This home is located at 9 Chalamont Way, Little Rock, AR 72223 and is currently estimated at $467,414, approximately $163 per square foot. 9 Chalamont Way is a home located in Pulaski County with nearby schools including Joe T. Robinson Elementary School, Joe T. Robinson Middle School, and Joe T. Robinson High School.
Ownership History
Date
Name
Owned For
Owner Type
Purchase Details
Closed on
Dec 6, 2017
Sold by
Andrew William and Certain Travis G
Bought by
Revo William and Revo G T
Current Estimated Value
Purchase Details
Closed on
Aug 30, 2006
Sold by
Talamo Giampaolo and Santini Elisabetta
Bought by
Certain William Andrew and Certain Gay Phelps
Purchase Details
Closed on
Dec 10, 2002
Sold by
Talamo Giampaolo
Bought by
Talamo Giampaolo and Santini Elisabetta
Home Financials for this Owner
Home Financials are based on the most recent Mortgage that was taken out on this home.
Original Mortgage
$244,000
Interest Rate
6.05%
Purchase Details
Closed on
Dec 14, 2001
Sold by
Deltic Timber Corp and Mccray Jack R
Bought by
R B Ewing Builders Inc
Home Financials for this Owner
Home Financials are based on the most recent Mortgage that was taken out on this home.
Original Mortgage
$34,100
Interest Rate
6.73%
Create a Home Valuation Report for This Property
The Home Valuation Report is an in-depth analysis detailing your home's value as well as a comparison with similar homes in the area
Home Values in the Area
Average Home Value in this Area
Purchase History
| Date | Buyer | Sale Price | Title Company |
|---|---|---|---|
| Revo William | -- | None Available | |
| Certain William Andrew | $300,000 | Stewart Title Of Arkansas | |
| Talamo Giampaolo | -- | American Abstract & Title Co | |
| Talamo Giampaolo | $305,000 | American Abstract & Title Co | |
| R B Ewing Builders Inc | $38,000 | Lenders Title Co |
Source: Public Records
Mortgage History
| Date | Status | Borrower | Loan Amount |
|---|---|---|---|
| Previous Owner | Talamo Giampaolo | $244,000 | |
| Previous Owner | R B Ewing Builders Inc | $34,100 |
Source: Public Records
Tax History Compared to Growth
Tax History
| Year | Tax Paid | Tax Assessment Tax Assessment Total Assessment is a certain percentage of the fair market value that is determined by local assessors to be the total taxable value of land and additions on the property. | Land | Improvement |
|---|---|---|---|---|
| 2025 | $3,479 | $75,259 | $9,600 | $65,659 |
| 2024 | $3,479 | $75,259 | $9,600 | $65,659 |
| 2023 | $3,479 | $75,259 | $9,600 | $65,659 |
| 2022 | $3,104 | $75,259 | $9,600 | $65,659 |
| 2021 | $3,506 | $54,100 | $9,900 | $44,200 |
| 2020 | $3,104 | $54,100 | $9,900 | $44,200 |
| 2019 | $3,104 | $54,100 | $9,900 | $44,200 |
| 2018 | $3,129 | $54,100 | $9,900 | $44,200 |
| 2017 | $3,129 | $54,100 | $9,900 | $44,200 |
| 2016 | $3,306 | $56,860 | $11,800 | $45,060 |
| 2015 | $3,685 | $56,860 | $11,800 | $45,060 |
| 2014 | $3,685 | $56,860 | $11,800 | $45,060 |
Source: Public Records
Map
Nearby Homes
- 11 Chalamont Way
- 16 Chalamont Way
- 27 Clervaux Dr
- 29 Clervaux Dr
- 5 Chalamont Way
- 15 Chalamont Way
- 25 Clervaux Dr
- 200 Chalamont Ln
- 31 Clervaux Dr
- 201 Chalamont Ln
- 23 Clervaux Dr
- 35 Clervaux Dr
- 0 Chalamont Way Unit 15021422
- 0 Chalamont Way Unit 15022074
- 0 Chalamont Way Unit 15028317
- 0 Chalamont Way Unit 16022338
- 0 Chalamont Way Unit 16026487
- 0 Chalamont Way Unit 16030090
- 0 Chalamont Way Unit 17002051
- 0 Chalamont Way Unit 17006226