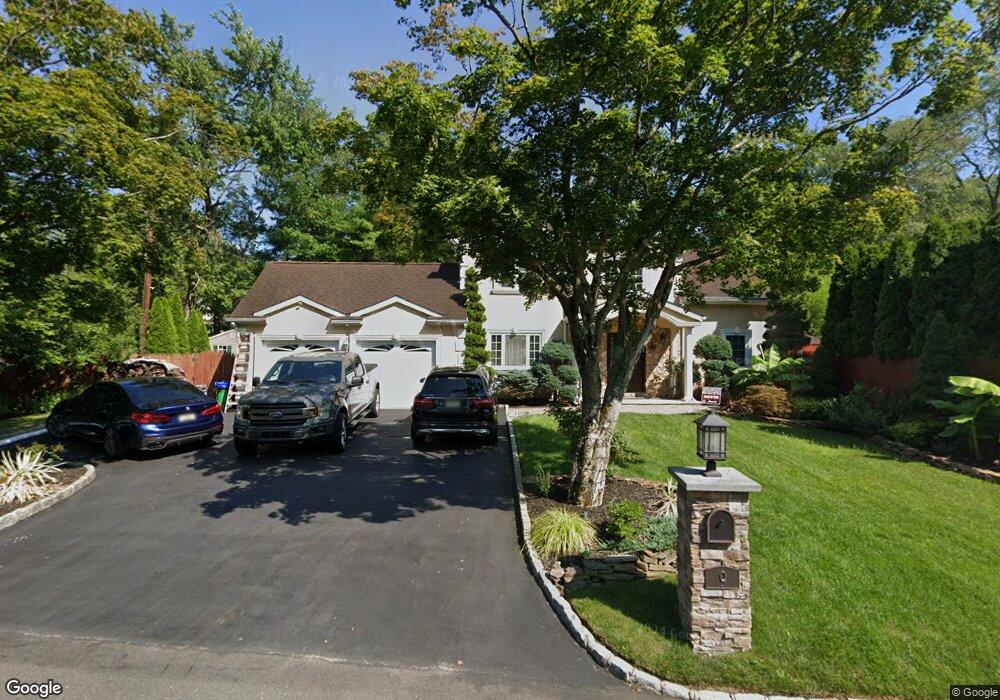
9 Charles St Matawan, NJ 07747
Estimated Value: $552,000 - $601,000
3
Beds
3
Baths
1,640
Sq Ft
$353/Sq Ft
Est. Value
About This Home
This home is located at 9 Charles St, Matawan, NJ 07747 and is currently estimated at $579,012, approximately $353 per square foot. 9 Charles St is a home located in Monmouth County with nearby schools including Matawan Reg High School, Matawan Montessori Academy, and St. Joseph Elementary School.
Ownership History
Date
Name
Owned For
Owner Type
Purchase Details
Closed on
Oct 17, 2002
Sold by
Palumbo Gaetano
Bought by
Tadrous Sameh and Wisniewska Emilia
Current Estimated Value
Home Financials for this Owner
Home Financials are based on the most recent Mortgage that was taken out on this home.
Original Mortgage
$153,000
Outstanding Balance
$63,722
Interest Rate
6.07%
Estimated Equity
$515,290
Create a Home Valuation Report for This Property
The Home Valuation Report is an in-depth analysis detailing your home's value as well as a comparison with similar homes in the area
Home Values in the Area
Average Home Value in this Area
Purchase History
| Date | Buyer | Sale Price | Title Company |
|---|---|---|---|
| Tadrous Sameh | $170,000 | -- |
Source: Public Records
Mortgage History
| Date | Status | Borrower | Loan Amount |
|---|---|---|---|
| Open | Tadrous Sameh | $153,000 |
Source: Public Records
Tax History Compared to Growth
Tax History
| Year | Tax Paid | Tax Assessment Tax Assessment Total Assessment is a certain percentage of the fair market value that is determined by local assessors to be the total taxable value of land and additions on the property. | Land | Improvement |
|---|---|---|---|---|
| 2025 | $9,440 | $522,100 | $278,400 | $243,700 |
| 2024 | $9,899 | $467,100 | $227,900 | $239,200 |
| 2023 | $9,899 | $462,800 | $213,200 | $249,600 |
| 2022 | $10,273 | $450,400 | $212,800 | $237,600 |
| 2021 | $10,273 | $400,600 | $189,200 | $211,400 |
| 2020 | $10,009 | $368,800 | $162,200 | $206,600 |
| 2019 | $10,271 | $367,600 | $162,200 | $205,400 |
| 2018 | $9,640 | $345,900 | $150,100 | $195,800 |
| 2017 | $7,857 | $285,900 | $121,100 | $164,800 |
| 2016 | $7,025 | $266,800 | $106,100 | $160,700 |
| 2015 | $7,258 | $264,600 | $108,100 | $156,500 |
| 2014 | $7,225 | $268,600 | $113,100 | $155,500 |
Source: Public Records
Map
Nearby Homes