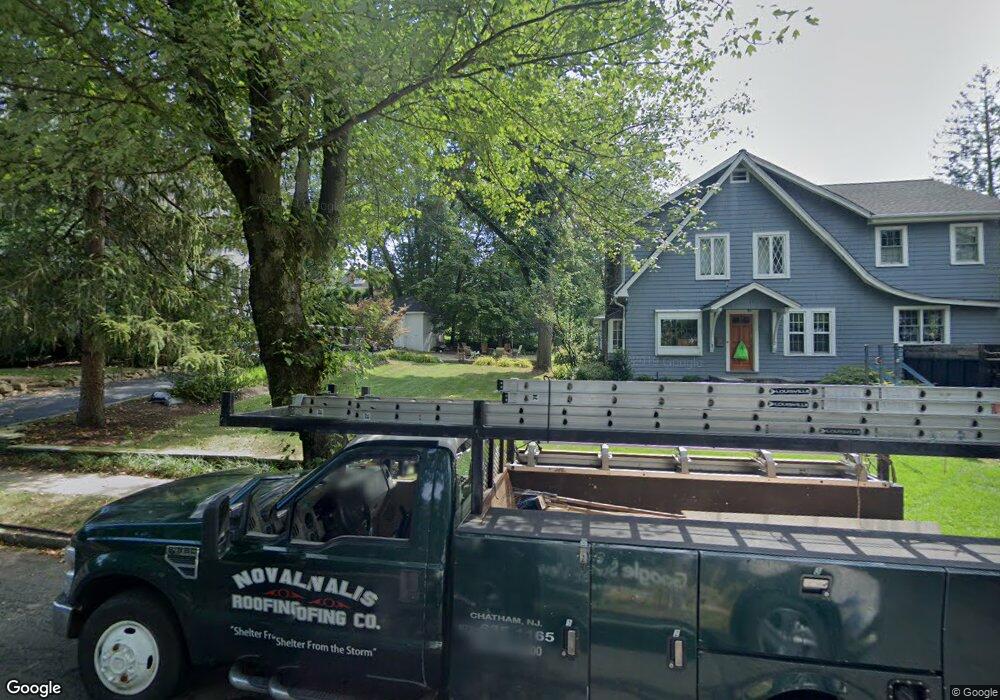
9 Chatham St Chatham, NJ 07928
Estimated Value: $1,085,000 - $1,647,000
--
Bed
--
Bath
1,821
Sq Ft
$758/Sq Ft
Est. Value
About This Home
This home is located at 9 Chatham St, Chatham, NJ 07928 and is currently estimated at $1,379,656, approximately $757 per square foot. 9 Chatham St is a home located in Morris County with nearby schools including Chatham High School, St. Patrick School, and ECLC of New Jersey.
Ownership History
Date
Name
Owned For
Owner Type
Purchase Details
Closed on
Dec 18, 2000
Sold by
Rosenburgh Michelle M and Desjadon Patricia A
Bought by
Mikulewicz Joseph and Fogarty Mikulewicz Brenda
Current Estimated Value
Home Financials for this Owner
Home Financials are based on the most recent Mortgage that was taken out on this home.
Original Mortgage
$452,000
Outstanding Balance
$166,566
Interest Rate
7.7%
Estimated Equity
$1,213,090
Create a Home Valuation Report for This Property
The Home Valuation Report is an in-depth analysis detailing your home's value as well as a comparison with similar homes in the area
Home Values in the Area
Average Home Value in this Area
Purchase History
| Date | Buyer | Sale Price | Title Company |
|---|---|---|---|
| Mikulewicz Joseph | $565,000 | Chicago Title Insurance Co |
Source: Public Records
Mortgage History
| Date | Status | Borrower | Loan Amount |
|---|---|---|---|
| Open | Mikulewicz Joseph | $452,000 |
Source: Public Records
Tax History Compared to Growth
Tax History
| Year | Tax Paid | Tax Assessment Tax Assessment Total Assessment is a certain percentage of the fair market value that is determined by local assessors to be the total taxable value of land and additions on the property. | Land | Improvement |
|---|---|---|---|---|
| 2025 | $13,324 | $823,000 | $519,800 | $303,200 |
| 2024 | $12,789 | $823,000 | $519,800 | $303,200 |
| 2023 | $12,789 | $823,000 | $519,800 | $303,200 |
| 2022 | $12,685 | $593,600 | $376,400 | $217,200 |
| 2021 | $12,685 | $593,600 | $376,400 | $217,200 |
| 2020 | $12,578 | $593,600 | $376,400 | $217,200 |
| 2019 | $12,489 | $593,600 | $376,400 | $217,200 |
| 2018 | $12,139 | $593,600 | $376,400 | $217,200 |
| 2017 | $11,789 | $593,600 | $376,400 | $217,200 |
| 2016 | $11,480 | $593,600 | $376,400 | $217,200 |
| 2015 | $11,344 | $593,600 | $376,400 | $217,200 |
| 2014 | $11,261 | $593,600 | $376,400 | $217,200 |
Source: Public Records
Map
Nearby Homes
- 128 Fairmount Ave
- 47 Red Rd
- 62 Lincoln Ave
- 24 Bridge St
- 5 Woodland Rd
- 1 John St
- 14 Schindler Ct Unit F27
- 25 Roosevelt Ave
- 102 Center Ave
- 55 River Rd
- 2 Duchamp Place
- 85 Kings Rd
- 3 Woodland Rd
- 37 Plain St
- 111 N Summit Ave
- 151 Center Ave
- 380 Main St Unit19
- 206 Longwood Ave
- 44 Brooklake Rd
- 54 Canterbury Rd