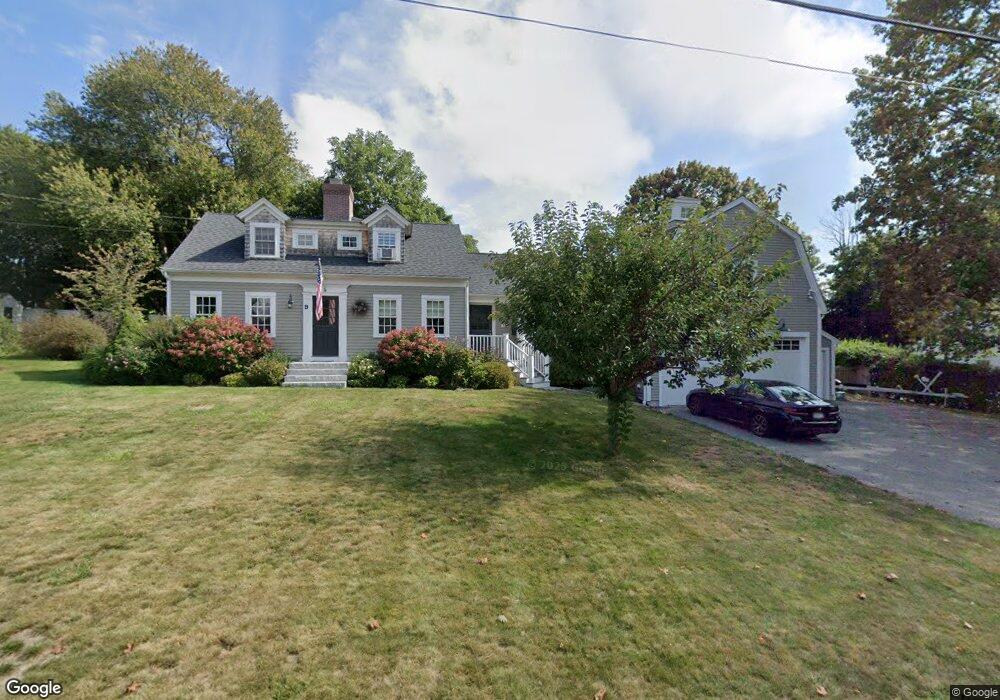
9 Clay Spring Rd Cohasset, MA 02025
Estimated Value: $1,216,000 - $1,850,949
4
Beds
6
Baths
4,816
Sq Ft
$342/Sq Ft
Est. Value
About This Home
This home is located at 9 Clay Spring Rd, Cohasset, MA 02025 and is currently estimated at $1,648,237, approximately $342 per square foot. 9 Clay Spring Rd is a home located in Norfolk County with nearby schools including Joseph Osgood School, Deer Hill School, and Cohasset Middle School.
Ownership History
Date
Name
Owned For
Owner Type
Purchase Details
Closed on
Jun 16, 2000
Sold by
Frederick David B and Frederick Michelle C
Bought by
Puzella Karen F and Puzella Mark S
Current Estimated Value
Purchase Details
Closed on
Aug 2, 1999
Sold by
Mcgovern Daniel H and Mcgovern Bridget M
Bought by
Frederick David B
Purchase Details
Closed on
Mar 17, 1992
Sold by
Blackstone Marianne
Bought by
Mcgovern Daniel H
Purchase Details
Closed on
May 3, 1990
Sold by
Miller Ronn E
Bought by
Blackstone Marianne
Create a Home Valuation Report for This Property
The Home Valuation Report is an in-depth analysis detailing your home's value as well as a comparison with similar homes in the area
Home Values in the Area
Average Home Value in this Area
Purchase History
| Date | Buyer | Sale Price | Title Company |
|---|---|---|---|
| Puzella Karen F | $333,000 | -- | |
| Frederick David B | $290,000 | -- | |
| Mcgovern Daniel H | $185,000 | -- | |
| Mcgovern Daniel H | $185,000 | -- | |
| Blackstone Marianne | $215,000 | -- | |
| Blackstone Marianne | $215,000 | -- |
Source: Public Records
Mortgage History
| Date | Status | Borrower | Loan Amount |
|---|---|---|---|
| Open | Blackstone Marianne | $585,000 | |
| Closed | Blackstone Marianne | $252,700 |
Source: Public Records
Tax History
| Year | Tax Paid | Tax Assessment Tax Assessment Total Assessment is a certain percentage of the fair market value that is determined by local assessors to be the total taxable value of land and additions on the property. | Land | Improvement |
|---|---|---|---|---|
| 2025 | $15,733 | $1,358,600 | $481,000 | $877,600 |
| 2024 | $15,536 | $1,276,600 | $384,800 | $891,800 |
| 2023 | $14,633 | $1,240,100 | $384,600 | $855,500 |
| 2022 | $13,435 | $1,069,700 | $285,100 | $784,600 |
| 2021 | $13,139 | $1,007,600 | $285,100 | $722,500 |
| 2020 | $10,464 | $806,800 | $257,400 | $549,400 |
| 2019 | $9,374 | $726,700 | $257,400 | $469,300 |
| 2018 | $9,294 | $726,700 | $257,400 | $469,300 |
| 2017 | $9,237 | $707,300 | $245,100 | $462,200 |
| 2016 | $9,110 | $707,300 | $245,100 | $462,200 |
| 2015 | $8,990 | $707,300 | $245,100 | $462,200 |
| 2014 | $8,870 | $707,300 | $245,100 | $462,200 |
Source: Public Records
Map
Nearby Homes
- 12 Tupelo Rd
- 46 Pond St
- 101 Pond St
- 45 Hemlock Way
- 40 Pond St
- 31 Chittenden Ln Unit 31
- 175 Sohier St
- 147 S Main St
- 171 S Main St
- 3 Brook St Unit A
- 212 S Main St
- 71 Ledgewood Dr
- 128 Elm St Unit 211
- 128 Elm St Unit 210
- 137 Fairoaks Ln
- 66 Summer St
- 98 Black Horse Ln
- 84 Elm St
- 27 Ox Pasture Ln
- 87 Elm St Unit 216
Your Personal Tour Guide
Ask me questions while you tour the home.