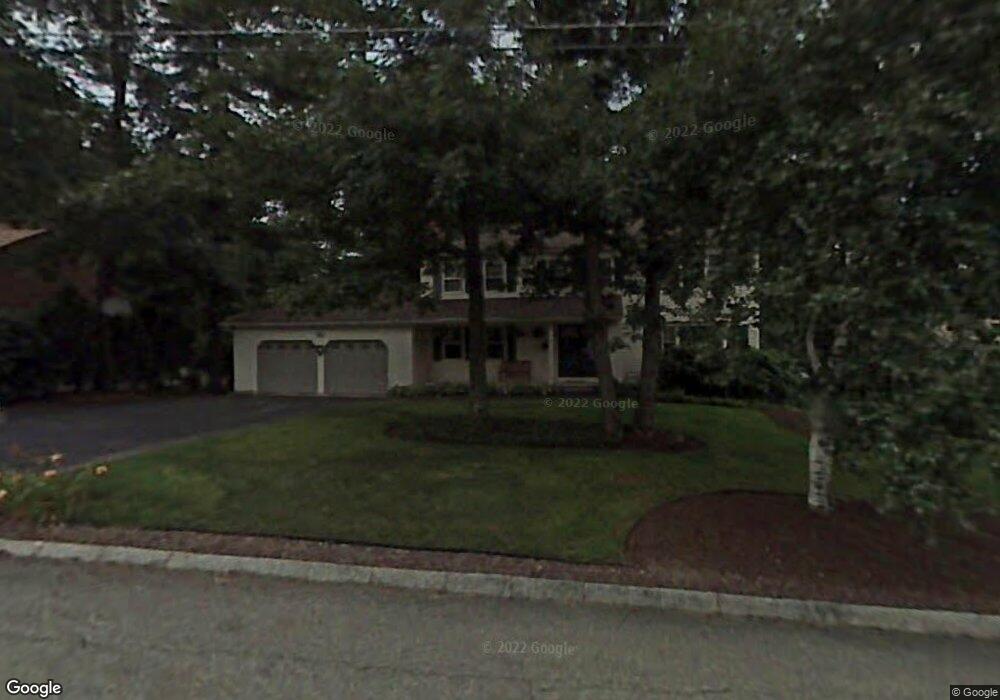
9 Clear View Dr Nashua, NH 03062
Southwest Nashua NeighborhoodEstimated Value: $641,000 - $697,000
4
Beds
3
Baths
2,184
Sq Ft
$301/Sq Ft
Est. Value
About This Home
This home is located at 9 Clear View Dr, Nashua, NH 03062 and is currently estimated at $657,908, approximately $301 per square foot. 9 Clear View Dr is a home located in Hillsborough County with nearby schools including Bicentennial Elementary School, Fairgrounds Middle School, and Nashua High School South.
Ownership History
Date
Name
Owned For
Owner Type
Purchase Details
Closed on
Feb 3, 2020
Sold by
Tereshko Michael J and Tereshko Kathleen R
Bought by
M J & K R Tereshko Ret and Tereshko
Current Estimated Value
Purchase Details
Closed on
Jul 16, 1985
Bought by
Tereshko Michael J and Tereshko Kathleen
Create a Home Valuation Report for This Property
The Home Valuation Report is an in-depth analysis detailing your home's value as well as a comparison with similar homes in the area
Home Values in the Area
Average Home Value in this Area
Purchase History
| Date | Buyer | Sale Price | Title Company |
|---|---|---|---|
| M J & K R Tereshko Ret | -- | None Available | |
| Tereshko Michael J | $168,000 | -- |
Source: Public Records
Mortgage History
| Date | Status | Borrower | Loan Amount |
|---|---|---|---|
| Previous Owner | Tereshko Michael J | $145,000 | |
| Previous Owner | Tereshko Michael J | $50,000 | |
| Previous Owner | Tereshko Michael J | $144,300 | |
| Previous Owner | Tereshko Michael J | $150,000 |
Source: Public Records
Tax History
| Year | Tax Paid | Tax Assessment Tax Assessment Total Assessment is a certain percentage of the fair market value that is determined by local assessors to be the total taxable value of land and additions on the property. | Land | Improvement |
|---|---|---|---|---|
| 2024 | $9,666 | $607,900 | $167,400 | $440,500 |
| 2023 | $9,217 | $505,600 | $134,000 | $371,600 |
| 2022 | $9,136 | $505,600 | $134,000 | $371,600 |
| 2021 | $8,580 | $369,500 | $98,200 | $271,300 |
| 2020 | $8,332 | $368,500 | $98,200 | $270,300 |
| 2019 | $8,019 | $368,500 | $98,200 | $270,300 |
| 2018 | $7,816 | $368,500 | $98,200 | $270,300 |
| 2017 | $8,160 | $316,400 | $84,700 | $231,700 |
| 2016 | $7,932 | $316,400 | $84,700 | $231,700 |
| 2015 | $7,761 | $316,400 | $84,700 | $231,700 |
| 2014 | $7,609 | $316,400 | $84,700 | $231,700 |
Source: Public Records
Map
Nearby Homes
- 24 Shadwell Rd
- 139 Peele Rd
- 1 Thompson Rd Unit 109
- 17 Herrick St
- 21 Victor Ave
- 6 Hayden St
- 190 Knollwood Ave
- 130 Westwood Dr
- 1 E Hobart St
- 4 Autumn Leaf Dr Unit 8
- 10 Woodfield St
- 4 Lisa Dr
- 6 Mountain View St
- 54 Linton St
- 29 Nottingham Dr
- 2 Wakefield Dr
- 51 Farmington Rd
- 97 Linwood St
- 5 Wilderness Dr
- 51 Legacy Dr