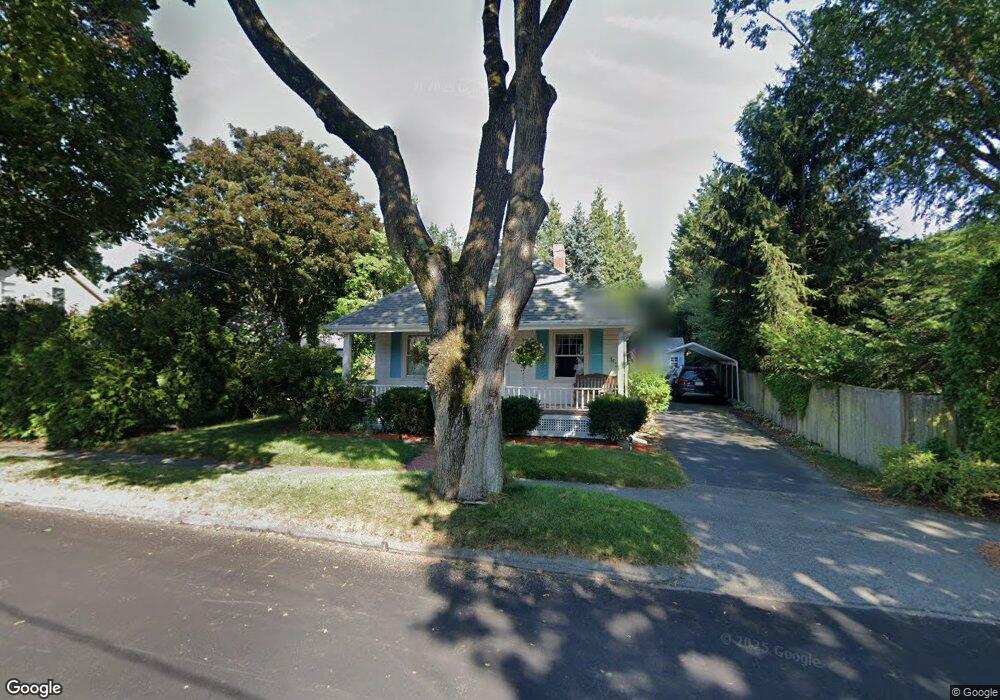
9 Columbia Rd Danvers, MA 01923
Estimated Value: $539,130 - $643,000
3
Beds
1
Bath
928
Sq Ft
$626/Sq Ft
Est. Value
About This Home
This home is located at 9 Columbia Rd, Danvers, MA 01923 and is currently estimated at $580,533, approximately $625 per square foot. 9 Columbia Rd is a home located in Essex County with nearby schools including Danvers High School and North Shore Christian School.
Ownership History
Date
Name
Owned For
Owner Type
Purchase Details
Closed on
Sep 8, 2025
Sold by
Macphee Donald D and Macphee Linda C
Bought by
Donald & Linda Macphee Rt and Macphee
Current Estimated Value
Purchase Details
Closed on
Nov 9, 2004
Sold by
Macphee Donald D and Miller Linda C
Bought by
Macphee Donald D
Home Financials for this Owner
Home Financials are based on the most recent Mortgage that was taken out on this home.
Original Mortgage
$0
Interest Rate
5.7%
Mortgage Type
Purchase Money Mortgage
Purchase Details
Closed on
Aug 23, 1996
Sold by
Lantych Scott P and Lantych Tamsen
Bought by
Macphee Donald D and Miller Linda
Purchase Details
Closed on
May 4, 1992
Sold by
Brigham Donald H and Brigham Charles
Bought by
Lantych Scott P and Lantych Tamsem C
Create a Home Valuation Report for This Property
The Home Valuation Report is an in-depth analysis detailing your home's value as well as a comparison with similar homes in the area
Home Values in the Area
Average Home Value in this Area
Purchase History
We collect this data history from publicly available records. To have your information removed, we recommend requesting removal directly through your county’s website.
| Date | Buyer | Sale Price | Title Company |
|---|---|---|---|
| Donald & Linda Macphee Rt | -- | -- | |
| Donald & Linda Macphee Rt | -- | -- | |
| Macphee Donald D | -- | -- | |
| Macphee Donald D | -- | -- | |
| Macphee Donald D | $142,900 | -- | |
| Macphee Donald D | $142,900 | -- | |
| Lantych Scott P | $128,000 | -- | |
| Lantych Scott P | $128,000 | -- |
Source: Public Records
Mortgage History
We collect this data history from publicly available records. To have your information removed, we recommend requesting removal directly through your county’s website.
| Date | Status | Borrower | Loan Amount |
|---|---|---|---|
| Previous Owner | Lantych Scott P | $0 | |
| Previous Owner | Lantych Scott P | $155,000 |
Source: Public Records
Tax History
| Year | Tax Paid | Tax Assessment Tax Assessment Total Assessment is a certain percentage of the fair market value that is determined by local assessors to be the total taxable value of land and additions on the property. | Land | Improvement |
|---|---|---|---|---|
| 2025 | $5,518 | $502,100 | $349,300 | $152,800 |
| 2024 | $5,424 | $488,200 | $337,300 | $150,900 |
| 2023 | $5,190 | $441,700 | $304,700 | $137,000 |
| 2022 | $5,174 | $408,700 | $277,000 | $131,700 |
| 2021 | $4,915 | $368,200 | $263,800 | $104,400 |
| 2020 | $4,666 | $357,300 | $263,800 | $93,500 |
| 2019 | $4,344 | $327,100 | $228,900 | $98,200 |
| 2018 | $4,323 | $319,300 | $228,900 | $90,400 |
| 2017 | $4,240 | $298,800 | $208,400 | $90,400 |
| 2016 | $4,105 | $289,100 | $198,700 | $90,400 |
| 2015 | $3,812 | $255,700 | $174,700 | $81,000 |
Source: Public Records
Map
Nearby Homes
- 4 Alden St Unit 3
- 22 Burley St
- 8 Putnam St Unit 3
- 180 Conant Conant St
- 19 Edmunds Cove
- 6 Jersey Ln
- 62 Purchase St Unit C3
- 9 College Pond Dr
- 53 Summer St
- 95 Abington Rd Unit 95
- 45 Abington Rd Unit 45
- 162 High St Unit B
- 166 High St
- 130 Pine St
- 146 Hobart St
- 27 Garfield Ave
- 97 Sylvan St Unit 7
- 307 Maple St Unit 307
- 58 River St Unit 3
- 37 Princeton St
Your Personal Tour Guide
Ask me questions while you tour the home.