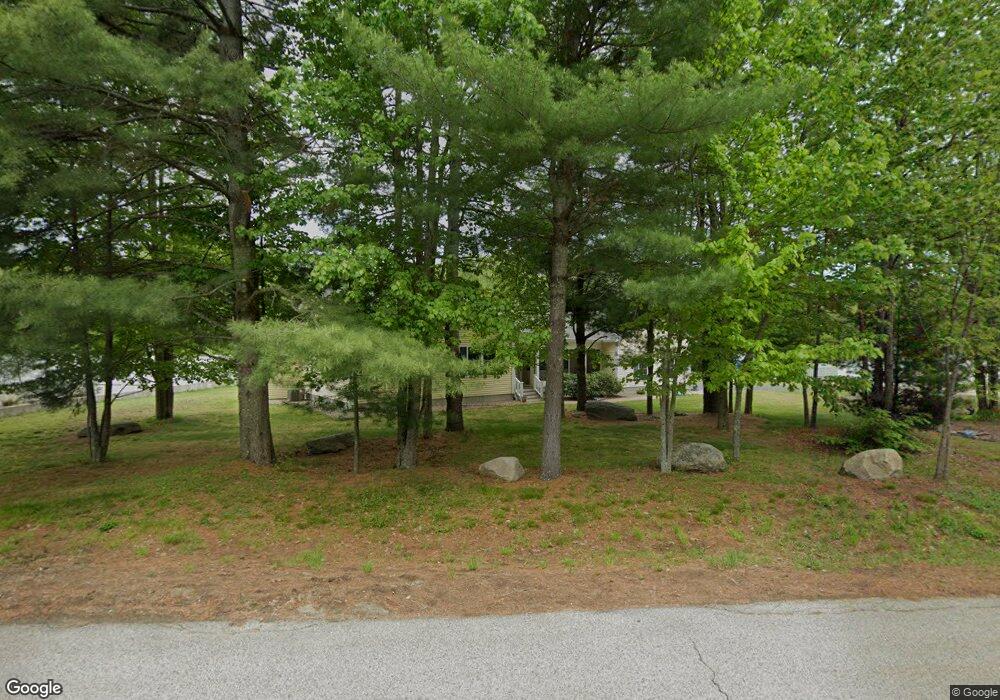
9 Crimson Ln Rochester, NH 03868
Estimated Value: $515,000 - $639,000
3
Beds
2
Baths
2,008
Sq Ft
$297/Sq Ft
Est. Value
About This Home
This home is located at 9 Crimson Ln, Rochester, NH 03868 and is currently estimated at $597,083, approximately $297 per square foot. 9 Crimson Ln is a home located in Strafford County with nearby schools including East Rochester School, Nancy Loud School, and Rochester Middle School.
Ownership History
Date
Name
Owned For
Owner Type
Purchase Details
Closed on
Jun 28, 2023
Sold by
Mcpheters Kenneth K and Mcpheters Jean W
Bought by
Mcpheters Grantor T and Mcpheters M
Current Estimated Value
Purchase Details
Closed on
Nov 13, 2012
Sold by
Holmewood Dev
Bought by
Mcpheters Kenneth K and Mcpheters Jean W
Purchase Details
Closed on
Sep 30, 2010
Sold by
Snyder Lt and Snyder
Bought by
Holmewood Dev Co Llc
Home Financials for this Owner
Home Financials are based on the most recent Mortgage that was taken out on this home.
Original Mortgage
$220,000
Interest Rate
4.44%
Mortgage Type
Purchase Money Mortgage
Purchase Details
Closed on
Dec 17, 2009
Sold by
Walbridge Steven and Snyder Lt
Bought by
Snyder Lt and Snyder
Create a Home Valuation Report for This Property
The Home Valuation Report is an in-depth analysis detailing your home's value as well as a comparison with similar homes in the area
Home Values in the Area
Average Home Value in this Area
Purchase History
| Date | Buyer | Sale Price | Title Company |
|---|---|---|---|
| Mcpheters Grantor T | -- | None Available | |
| Mcpheters Grantor T | -- | None Available | |
| Mcpheters Kenneth K | $249,000 | -- | |
| Mcpheters Kenneth K | $249,000 | -- | |
| Holmewood Dev Co Llc | $70,000 | -- | |
| Holmewood Dev Co Llc | $70,000 | -- | |
| Snyder Lt | $44,000 | -- | |
| Snyder Lt | $44,000 | -- |
Source: Public Records
Mortgage History
| Date | Status | Borrower | Loan Amount |
|---|---|---|---|
| Previous Owner | Snyder Lt | $220,000 | |
| Closed | Snyder Lt | $0 |
Source: Public Records
Tax History Compared to Growth
Tax History
| Year | Tax Paid | Tax Assessment Tax Assessment Total Assessment is a certain percentage of the fair market value that is determined by local assessors to be the total taxable value of land and additions on the property. | Land | Improvement |
|---|---|---|---|---|
| 2024 | $8,925 | $601,000 | $120,400 | $480,600 |
| 2023 | $8,999 | $349,600 | $51,000 | $298,600 |
| 2022 | $8,838 | $349,600 | $51,000 | $298,600 |
| 2021 | $8,618 | $349,600 | $51,000 | $298,600 |
| 2020 | $8,604 | $349,600 | $51,000 | $298,600 |
| 2019 | $8,705 | $349,600 | $51,000 | $298,600 |
| 2018 | $8,636 | $313,800 | $51,000 | $262,800 |
| 2017 | $8,684 | $329,800 | $51,000 | $278,800 |
| 2016 | $8,481 | $300,100 | $51,000 | $249,100 |
| 2015 | $8,448 | $300,100 | $51,000 | $249,100 |
| 2014 | $8,604 | $313,200 | $51,000 | $262,200 |
| 2013 | $7,225 | $274,100 | $60,300 | $213,800 |
| 2012 | $6,559 | $255,400 | $60,300 | $195,100 |
Source: Public Records
Map
Nearby Homes
- 524 Salmon Falls Rd
- 859 Salmon Falls Rd
- 616 Portland St Unit 75
- 10 Smoke St
- 871 Salmon Falls Rd
- 631 Salmon Falls Rd
- 632 Salmon Falls Rd
- 19 Vernon Ave
- 17 Maplewood Ave
- 68 Moose Ln
- 39 Ida Cir
- 3 Freedom Dr Unit 17
- 2 Freedom Dr
- 518 & 532 Portland St
- 80 Woodland Green
- 27 Highland St
- 33 Copps Dr
- 21 Copps Dr
- 17 Copps Dr
- 10 Erin Ln
- 5 Crimson Ln
- 11 Crimson Ln
- 2 Crimson Ln
- 6 Crimson Ln
- 6 Crimson Ln
- 13 Crimson Ln
- 10 Crimson Ln
- 15 Walbridge Ct
- 533 Salmon Falls Rd
- 539 Salmon Falls Rd
- 14 Crimson Ln
- 527 Salmon Falls Rd
- 19 Crimson Ln
- 523 Salmon Falls Rd
- 20 Crimson Ln
- 534 Salmon Falls Rd
- 517 Salmon Falls Rd
- 19 Pray St
- 547 Salmon Falls Rd
- 540 Salmon Falls Rd