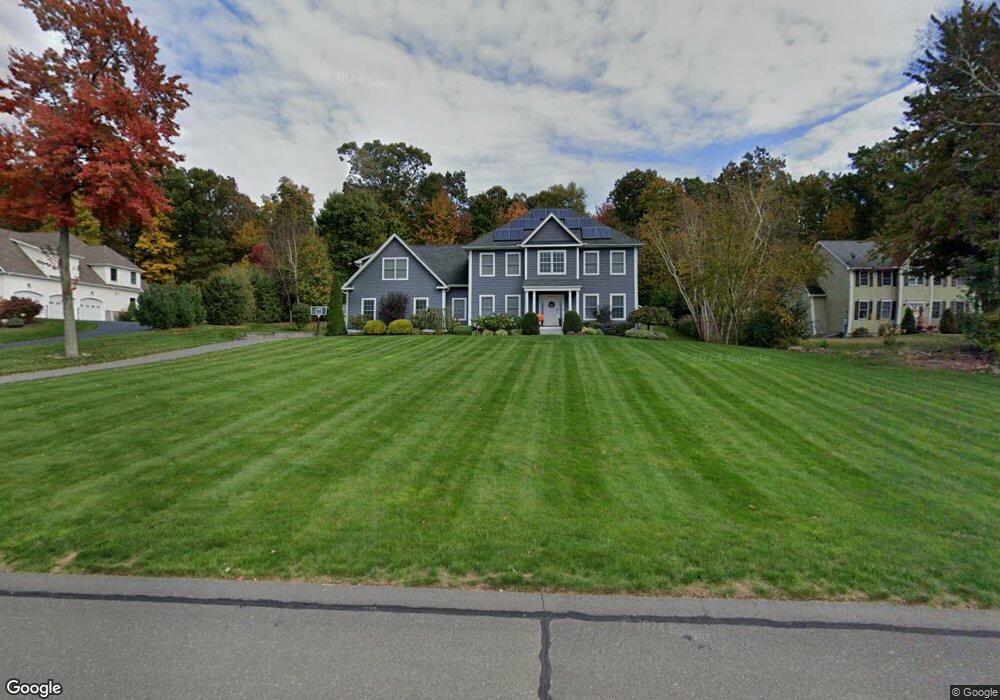
9 Daisy Ln Ellington, CT 06029
Estimated Value: $704,985 - $784,000
4
Beds
2
Baths
2,878
Sq Ft
$258/Sq Ft
Est. Value
About This Home
This home is located at 9 Daisy Ln, Ellington, CT 06029 and is currently estimated at $742,996, approximately $258 per square foot. 9 Daisy Ln is a home located in Tolland County with nearby schools including Ellington High School.
Ownership History
Date
Name
Owned For
Owner Type
Purchase Details
Closed on
Sep 21, 2011
Sold by
Jackies Homes Llc
Bought by
Caraballo Juan R
Current Estimated Value
Home Financials for this Owner
Home Financials are based on the most recent Mortgage that was taken out on this home.
Original Mortgage
$427,871
Outstanding Balance
$296,341
Interest Rate
4.5%
Mortgage Type
FHA
Estimated Equity
$446,655
Purchase Details
Closed on
May 1, 2009
Sold by
Ryefield Next Shift Ll
Bought by
Jackies Homes Llc
Create a Home Valuation Report for This Property
The Home Valuation Report is an in-depth analysis detailing your home's value as well as a comparison with similar homes in the area
Home Values in the Area
Average Home Value in this Area
Purchase History
| Date | Buyer | Sale Price | Title Company |
|---|---|---|---|
| Caraballo Juan R | $439,000 | -- | |
| Jackies Homes Llc | $179,800 | -- |
Source: Public Records
Mortgage History
| Date | Status | Borrower | Loan Amount |
|---|---|---|---|
| Open | Jackies Homes Llc | $427,871 |
Source: Public Records
Tax History Compared to Growth
Tax History
| Year | Tax Paid | Tax Assessment Tax Assessment Total Assessment is a certain percentage of the fair market value that is determined by local assessors to be the total taxable value of land and additions on the property. | Land | Improvement |
|---|---|---|---|---|
| 2025 | $11,721 | $315,940 | $72,240 | $243,700 |
| 2024 | $11,374 | $315,940 | $72,240 | $243,700 |
| 2023 | $10,837 | $315,940 | $72,240 | $243,700 |
| 2022 | $10,268 | $315,940 | $72,240 | $243,700 |
| 2021 | $9,984 | $315,940 | $72,240 | $243,700 |
| 2020 | $10,072 | $308,960 | $73,630 | $235,330 |
| 2019 | $10,072 | $308,960 | $73,630 | $235,330 |
| 2016 | $9,420 | $308,860 | $73,630 | $235,230 |
| 2015 | $9,420 | $318,720 | $73,630 | $245,090 |
| 2014 | $9,147 | $318,720 | $73,630 | $245,090 |
Source: Public Records
Map
Nearby Homes