A
Seller's Agent in 2024
Ashley Guzman
Castinetti Realty Group
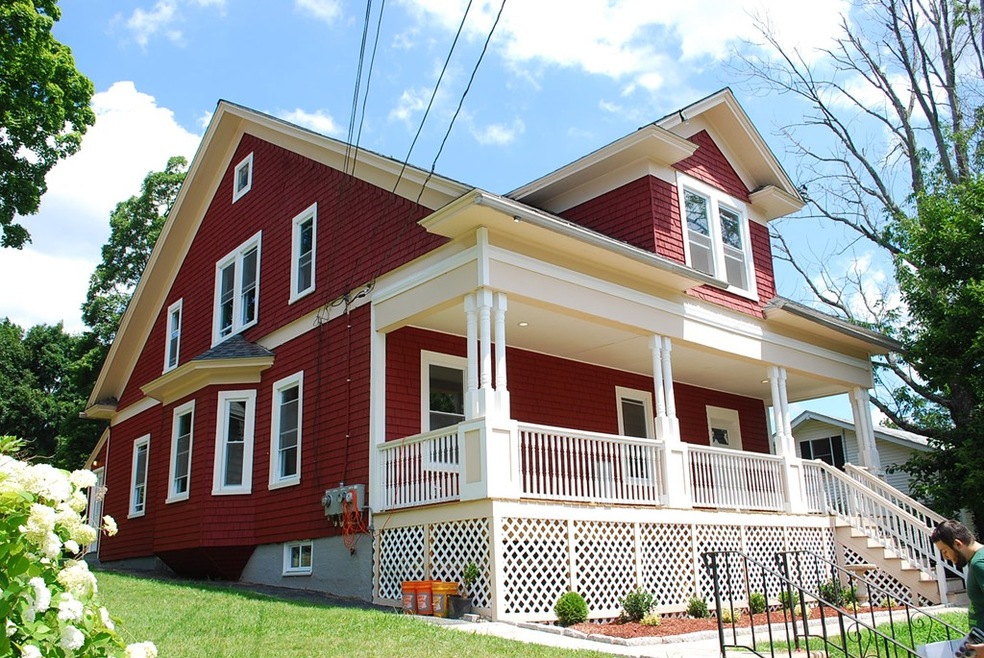
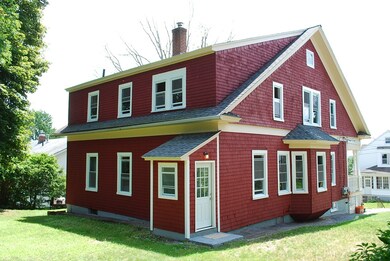
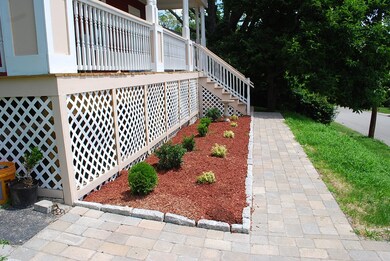

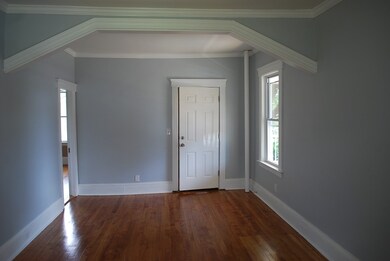
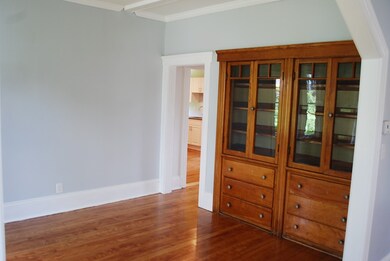
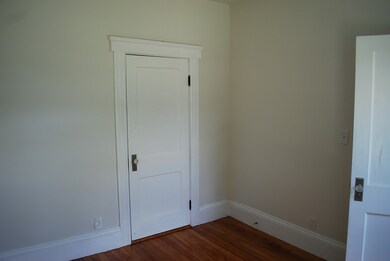
Extensive renovation completed in 2016. You will not be disappointed with this one. A 4-bedroom, 2-bath, spacious 2-family house in the Burncoat neighborhood, located on a very quiet dead end road of single family homes. Great location within 1/2 mile of Lincoln Street shopping ,Route 290 and Mass.Medical Both apartments have a new kitchen (all new appliances), new baths, refinished hardwood floors throughout, replacement windows, newer boilers, all new electrical wiring and panels, along with all new plumbing systems. All this along with restored original molding and trim. Beautiful covered front porch and a private rear yard with fire pit. Second floor den could be used as a 3rd bedroom or nursery. This is one of the best multi-family homes on the market today!
Last Agent to Sell the Property
Peter Tedesco
Mount Vernon Advisors License #449596380 Listed on: 07/17/2019
Last Buyer's Agent
Peter Tedesco
Mount Vernon Advisors License #449596380 Listed on: 07/17/2019
| Date | Type | Sale Price | Title Company |
|---|---|---|---|
| Quit Claim Deed | -- | -- | |
| Quit Claim Deed | -- | -- |
| Date | Event | Price | Change | Sq Ft Price |
|---|---|---|---|---|
| 06/06/2024 06/06/24 | Sold | $582,000 | +4.9% | $247 / Sq Ft |
| 04/23/2024 04/23/24 | Pending | -- | -- | -- |
| 04/17/2024 04/17/24 | For Sale | $555,000 | +53.3% | $235 / Sq Ft |
| 08/30/2019 08/30/19 | Sold | $362,000 | +0.7% | $169 / Sq Ft |
| 07/22/2019 07/22/19 | Pending | -- | -- | -- |
| 07/17/2019 07/17/19 | For Sale | $359,500 | +161.5% | $168 / Sq Ft |
| 11/04/2016 11/04/16 | Sold | $137,500 | -11.2% | $74 / Sq Ft |
| 10/03/2016 10/03/16 | Pending | -- | -- | -- |
| 09/20/2016 09/20/16 | For Sale | $154,900 | 0.0% | $83 / Sq Ft |
| 08/14/2016 08/14/16 | Pending | -- | -- | -- |
| 08/11/2016 08/11/16 | For Sale | $154,900 | 0.0% | $83 / Sq Ft |
| 07/26/2016 07/26/16 | Pending | -- | -- | -- |
| 07/14/2016 07/14/16 | For Sale | $154,900 | -- | $83 / Sq Ft |
| Year | Tax Paid | Tax Assessment Tax Assessment Total Assessment is a certain percentage of the fair market value that is determined by local assessors to be the total taxable value of land and additions on the property. | Land | Improvement |
|---|---|---|---|---|
| 2025 | $6,363 | $482,400 | $118,000 | $364,400 |
| 2024 | $6,097 | $443,400 | $118,000 | $325,400 |
| 2023 | $5,686 | $396,500 | $102,600 | $293,900 |
| 2022 | $5,465 | $359,300 | $82,100 | $277,200 |
| 2021 | $4,804 | $295,100 | $65,700 | $229,400 |
| 2020 | $4,000 | $235,300 | $65,700 | $169,600 |
| 2019 | $4,108 | $228,200 | $59,100 | $169,100 |
| 2018 | $4,026 | $212,900 | $59,100 | $153,800 |
| 2017 | $3,371 | $175,400 | $59,100 | $116,300 |
| 2016 | $3,232 | $156,800 | $43,100 | $113,700 |
| 2015 | $3,147 | $156,800 | $43,100 | $113,700 |
| 2014 | $3,064 | $156,800 | $43,100 | $113,700 |
A
Seller's Agent in 2024
Ashley Guzman
Castinetti Realty Group

Buyer's Agent in 2024
Nick D'Andrea
Property Investors & Advisors, LLC
(508) 735-3264
1 in this area
47 Total Sales
P
Seller's Agent in 2019
Peter Tedesco
Mount Vernon Advisors
Seller's Agent in 2016
Donna Flannery
ERA Key Realty Services- Spenc
(508) 612-6771
157 Total Sales
Source: MLS Property Information Network (MLS PIN)
MLS Number: 72535826
APN: WORC-000039-000004-000485
Disclaimer: Certain information contained herein is derived from information provided by parties other than Homes.com. All information provided is deemed reliable, but is not guaranteed to be accurate and should be independently verified.
![]() The property listing data and information, or the Images, set forth herein were provided to MLS Property Information Network, Inc. from third party sources, including sellers, lessors and public records, and were compiled by MLS Property Information Network, Inc. The property listing data and information, and the Images, are for the personal, non-commercial use of consumers having a good faith interest in purchasing or leasing listed properties of the type displayed to them and may not be used for any purpose other than to identify prospective properties which such consumers may have a good faith interest in purchasing or leasing. MLS Property Information Network, Inc. and its subscribers disclaim any and all representations and warranties as to the accuracy of the property listing data and information, or as to the accuracy of any of the Images, set forth herein.
The property listing data and information, or the Images, set forth herein were provided to MLS Property Information Network, Inc. from third party sources, including sellers, lessors and public records, and were compiled by MLS Property Information Network, Inc. The property listing data and information, and the Images, are for the personal, non-commercial use of consumers having a good faith interest in purchasing or leasing listed properties of the type displayed to them and may not be used for any purpose other than to identify prospective properties which such consumers may have a good faith interest in purchasing or leasing. MLS Property Information Network, Inc. and its subscribers disclaim any and all representations and warranties as to the accuracy of the property listing data and information, or as to the accuracy of any of the Images, set forth herein.