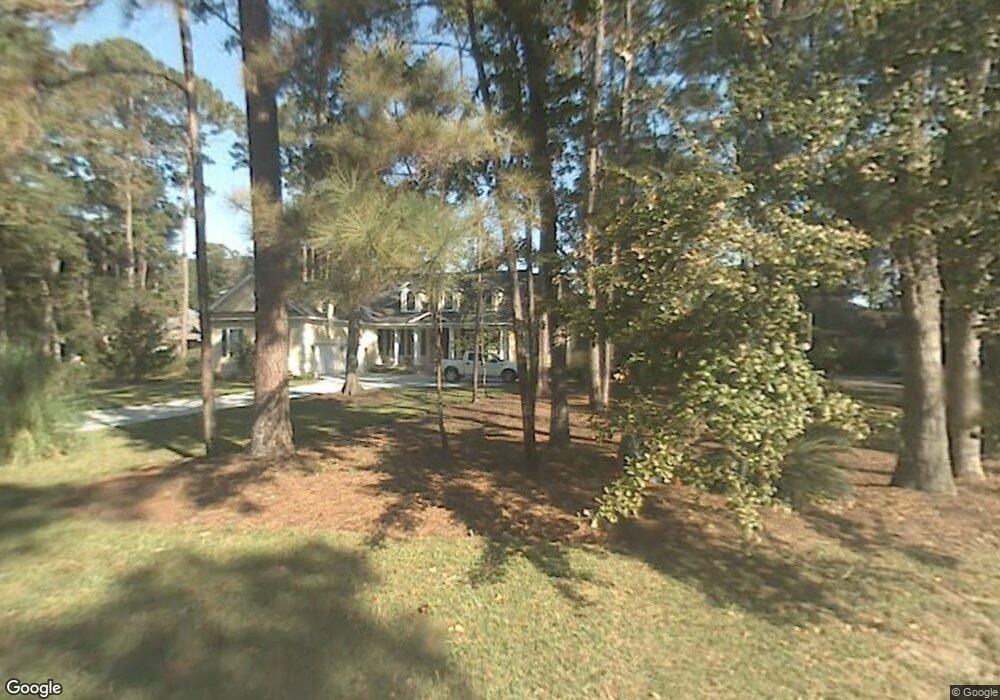
9 Deer Run Savannah, GA 31411
Estimated Value: $929,000 - $1,331,522
3
Beds
4
Baths
3,863
Sq Ft
$302/Sq Ft
Est. Value
About This Home
This home is located at 9 Deer Run, Savannah, GA 31411 and is currently estimated at $1,164,881, approximately $301 per square foot. 9 Deer Run is a home located in Chatham County with nearby schools including Hesse School, Jenkins High School, and Bethesda Academy.
Ownership History
Date
Name
Owned For
Owner Type
Purchase Details
Closed on
Apr 1, 2005
Sold by
Not Provided
Bought by
Sauer Trudy G
Current Estimated Value
Home Financials for this Owner
Home Financials are based on the most recent Mortgage that was taken out on this home.
Original Mortgage
$480,000
Outstanding Balance
$247,056
Interest Rate
5.74%
Mortgage Type
New Conventional
Estimated Equity
$917,825
Create a Home Valuation Report for This Property
The Home Valuation Report is an in-depth analysis detailing your home's value as well as a comparison with similar homes in the area
Home Values in the Area
Average Home Value in this Area
Purchase History
| Date | Buyer | Sale Price | Title Company |
|---|---|---|---|
| Sauer Trudy G | -- | -- |
Source: Public Records
Mortgage History
| Date | Status | Borrower | Loan Amount |
|---|---|---|---|
| Open | Sauer Trudy G | $480,000 |
Source: Public Records
Tax History
| Year | Tax Paid | Tax Assessment Tax Assessment Total Assessment is a certain percentage of the fair market value that is determined by local assessors to be the total taxable value of land and additions on the property. | Land | Improvement |
|---|---|---|---|---|
| 2025 | $10,429 | $490,560 | $130,000 | $360,560 |
| 2024 | $94 | $487,560 | $130,000 | $357,560 |
| 2023 | $9,423 | $415,680 | $130,000 | $285,680 |
| 2022 | $8,557 | $311,200 | $54,000 | $257,200 |
| 2021 | $8,569 | $251,800 | $49,000 | $202,800 |
| 2020 | $8,726 | $249,480 | $49,000 | $200,480 |
| 2019 | $8,810 | $249,480 | $49,000 | $200,480 |
| 2018 | $8,672 | $241,680 | $49,000 | $192,680 |
| 2017 | $8,254 | $243,080 | $49,000 | $194,080 |
| 2016 | $8,307 | $268,120 | $49,000 | $219,120 |
| 2015 | $7,881 | $242,000 | $49,000 | $193,000 |
| 2014 | $11,603 | $243,920 | $0 | $0 |
Source: Public Records
Map
Nearby Homes
- 20 Deer Run
- 22 Deer Run
- 1 Cavan Ln
- 5 Franklin Ct
- 15 Franklin Creek Rd N
- 17 Franklin Creek Rd N
- 110 Wickersham Dr
- 217 Wiley Bottom Rd
- 5 Fletcher Ln
- 38 Wiley Bottom Rd
- 402 Willeford Dr
- 2 Franklin Creek Rd S
- 1 Christie Ln
- 2 Low Country Ln
- 9 Schroeder Ct
- 5 Sundew Rd
- 15 Riding Ln
- 2 Mceachern Ct
- 138 Mercer Rd
- 4 Odingsell Ln
Your Personal Tour Guide
Ask me questions while you tour the home.