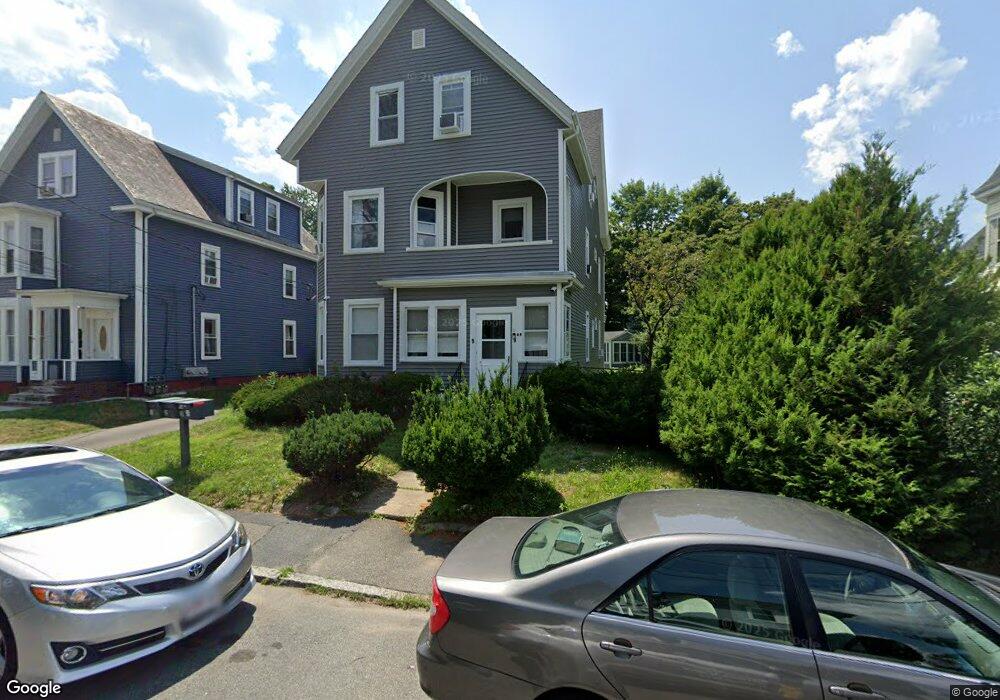
9 Denton St Unit 2,3 Brockton, MA 02301
Clifton Heights NeighborhoodEstimated Value: $820,000 - $1,039,402
3
Beds
1
Bath
1,200
Sq Ft
$780/Sq Ft
Est. Value
About This Home
This home is located at 9 Denton St Unit 2,3, Brockton, MA 02301 and is currently estimated at $936,351, approximately $780 per square foot. 9 Denton St Unit 2,3 is a home located in Plymouth County with nearby schools including John F. Kennedy Elementary School, Davis K-8 School, and South Middle School.
Ownership History
Date
Name
Owned For
Owner Type
Purchase Details
Closed on
Jun 30, 2021
Sold by
John J Mcneill T
Bought by
9 Denton Llc
Current Estimated Value
Home Financials for this Owner
Home Financials are based on the most recent Mortgage that was taken out on this home.
Original Mortgage
$280,000
Outstanding Balance
$254,057
Interest Rate
2.9%
Mortgage Type
Purchase Money Mortgage
Estimated Equity
$682,294
Purchase Details
Closed on
Sep 15, 2017
Sold by
Mcneill John J
Bought by
John J Mcneill T
Purchase Details
Closed on
Feb 19, 2016
Sold by
Mcneill Mary V
Bought by
Mcneill John J
Purchase Details
Closed on
Jan 19, 2016
Sold by
Booth Patricia A
Bought by
Mcneill Mary V
Purchase Details
Closed on
Dec 2, 2015
Sold by
Booth Patricia A
Bought by
Mcneill Mary V
Create a Home Valuation Report for This Property
The Home Valuation Report is an in-depth analysis detailing your home's value as well as a comparison with similar homes in the area
Home Values in the Area
Average Home Value in this Area
Purchase History
| Date | Buyer | Sale Price | Title Company |
|---|---|---|---|
| 9 Denton Llc | $430,000 | None Available | |
| John J Mcneill T | -- | -- | |
| Mcneill John J | -- | -- | |
| Mcneill Mary V | -- | -- | |
| Mcneill Mary V | $3,000 | -- |
Source: Public Records
Mortgage History
| Date | Status | Borrower | Loan Amount |
|---|---|---|---|
| Open | 9 Denton Llc | $280,000 |
Source: Public Records
Tax History Compared to Growth
Tax History
| Year | Tax Paid | Tax Assessment Tax Assessment Total Assessment is a certain percentage of the fair market value that is determined by local assessors to be the total taxable value of land and additions on the property. | Land | Improvement |
|---|---|---|---|---|
| 2025 | $9,532 | $787,100 | $140,400 | $646,700 |
| 2024 | $8,394 | $698,300 | $140,400 | $557,900 |
| 2023 | $7,649 | $589,300 | $106,000 | $483,300 |
| 2022 | $7,468 | $534,600 | $96,400 | $438,200 |
| 2021 | $6,873 | $474,000 | $80,500 | $393,500 |
| 2020 | $5,839 | $385,400 | $75,000 | $310,400 |
| 2019 | $5,765 | $371,000 | $73,000 | $298,000 |
| 2018 | $4,972 | $322,800 | $73,000 | $249,800 |
| 2017 | $4,972 | $308,800 | $73,000 | $235,800 |
| 2016 | $4,666 | $268,800 | $70,900 | $197,900 |
| 2015 | $3,695 | $203,600 | $70,900 | $132,700 |
| 2014 | $3,515 | $193,900 | $70,900 | $123,000 |
Source: Public Records
Map
Nearby Homes