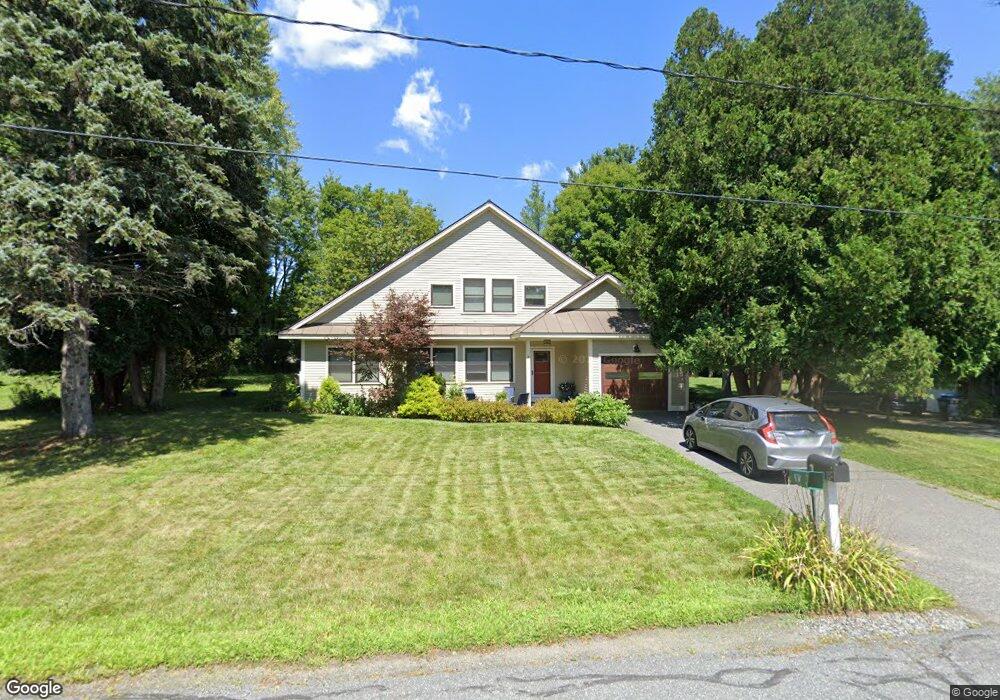
9 Dresden Rd Hanover, NH 03755
Estimated Value: $865,876 - $1,064,000
3
Beds
3
Baths
1,643
Sq Ft
$579/Sq Ft
Est. Value
About This Home
This home is located at 9 Dresden Rd, Hanover, NH 03755 and is currently estimated at $951,219, approximately $578 per square foot. 9 Dresden Rd is a home located in Grafton County with nearby schools including Bernice A. Ray School, Frances C. Richmond School, and Hanover High School.
Ownership History
Date
Name
Owned For
Owner Type
Purchase Details
Closed on
Jun 4, 2012
Sold by
Springett Roger and Sakata Yasuko
Bought by
Pearl Tr Michael A and Pearl Alyssa M
Current Estimated Value
Purchase Details
Closed on
May 6, 2004
Sold by
Trtes Of Dartmouth Col
Bought by
Springett Roger
Home Financials for this Owner
Home Financials are based on the most recent Mortgage that was taken out on this home.
Original Mortgage
$228,650
Interest Rate
5.39%
Mortgage Type
Purchase Money Mortgage
Create a Home Valuation Report for This Property
The Home Valuation Report is an in-depth analysis detailing your home's value as well as a comparison with similar homes in the area
Home Values in the Area
Average Home Value in this Area
Purchase History
| Date | Buyer | Sale Price | Title Company |
|---|---|---|---|
| Pearl Tr Michael A | $355,000 | -- | |
| Springett Roger | $269,000 | -- | |
| Pearl Tr Michael A | $355,000 | -- | |
| Springett Roger | $269,000 | -- |
Source: Public Records
Mortgage History
| Date | Status | Borrower | Loan Amount |
|---|---|---|---|
| Previous Owner | Springett Roger | $228,650 | |
| Closed | Springett Roger | $0 |
Source: Public Records
Tax History Compared to Growth
Tax History
| Year | Tax Paid | Tax Assessment Tax Assessment Total Assessment is a certain percentage of the fair market value that is determined by local assessors to be the total taxable value of land and additions on the property. | Land | Improvement |
|---|---|---|---|---|
| 2024 | $11,674 | $605,800 | $255,000 | $350,800 |
| 2023 | $11,232 | $605,800 | $255,000 | $350,800 |
| 2022 | $10,777 | $605,800 | $255,000 | $350,800 |
| 2021 | $10,632 | $602,700 | $255,000 | $347,700 |
| 2020 | $10,762 | $532,500 | $310,000 | $222,500 |
| 2019 | $10,613 | $532,500 | $310,000 | $222,500 |
| 2018 | $13,332 | $693,300 | $310,000 | $383,300 |
| 2017 | $6,883 | $467,300 | $196,400 | $270,900 |
| 2016 | $9,949 | $467,300 | $196,400 | $270,900 |
| 2015 | $9,757 | $467,300 | $196,400 | $270,900 |
| 2014 | $9,360 | $467,300 | $196,400 | $270,900 |
| 2013 | $6,042 | $312,900 | $196,400 | $116,500 |
| 2012 | $5,429 | $293,600 | $170,100 | $123,500 |
Source: Public Records
Map
Nearby Homes