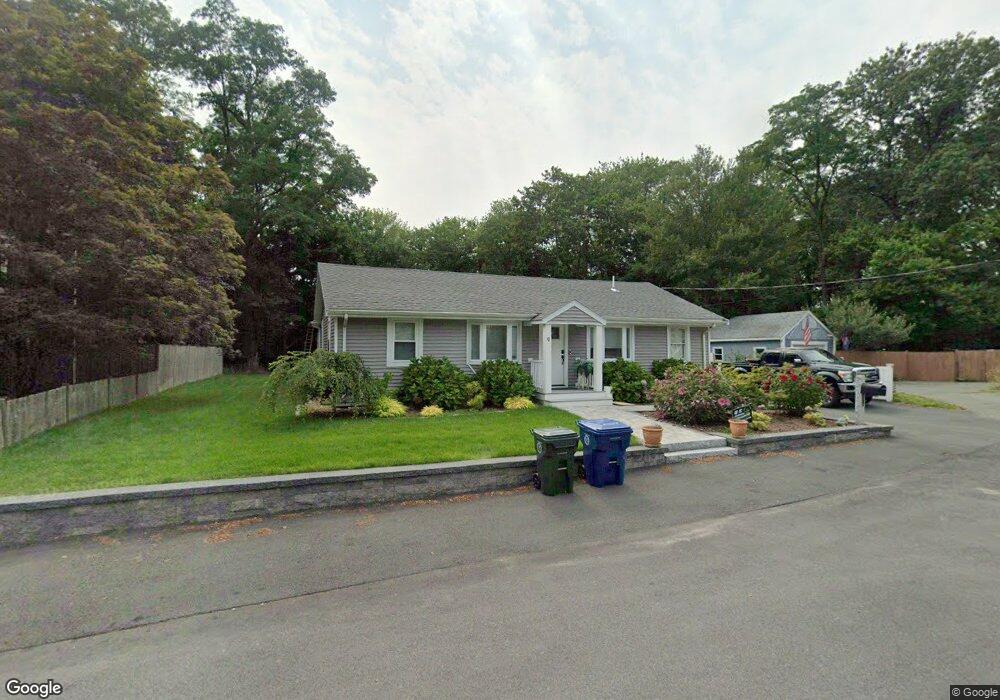
9 Durkee Cir Danvers, MA 01923
Estimated Value: $642,000 - $700,000
3
Beds
2
Baths
1,602
Sq Ft
$415/Sq Ft
Est. Value
About This Home
This home is located at 9 Durkee Cir, Danvers, MA 01923 and is currently estimated at $665,101, approximately $415 per square foot. 9 Durkee Cir is a home located in Essex County with nearby schools including Danvers High School, St. Mary of the Annunciation School, and St. John's Prep.
Ownership History
Date
Name
Owned For
Owner Type
Purchase Details
Closed on
Jan 8, 2021
Sold by
Boudreault Andrea J
Bought by
Ravida Bianca S
Current Estimated Value
Home Financials for this Owner
Home Financials are based on the most recent Mortgage that was taken out on this home.
Original Mortgage
$389,500
Outstanding Balance
$344,367
Interest Rate
2.7%
Mortgage Type
Purchase Money Mortgage
Estimated Equity
$320,734
Purchase Details
Closed on
Oct 22, 2003
Sold by
Boudreault Andrea J and Boudreault Stephen M
Bought by
Boudreault Andrea J
Home Financials for this Owner
Home Financials are based on the most recent Mortgage that was taken out on this home.
Original Mortgage
$0
Interest Rate
6.05%
Mortgage Type
Purchase Money Mortgage
Purchase Details
Closed on
Sep 26, 1991
Sold by
Violand Eugene A
Bought by
Boudreault Stephen M and Boudreault Andrea
Create a Home Valuation Report for This Property
The Home Valuation Report is an in-depth analysis detailing your home's value as well as a comparison with similar homes in the area
Home Values in the Area
Average Home Value in this Area
Purchase History
| Date | Buyer | Sale Price | Title Company |
|---|---|---|---|
| Ravida Bianca S | $410,000 | None Available | |
| Ravida Bianca S | $410,000 | None Available | |
| Boudreault Andrea J | -- | -- | |
| Boudreault Stephen M | $75,000 | -- |
Source: Public Records
Mortgage History
| Date | Status | Borrower | Loan Amount |
|---|---|---|---|
| Open | Ravida Bianca S | $389,500 | |
| Closed | Ravida Bianca S | $389,500 | |
| Previous Owner | Boudreault Stephen M | $316,000 | |
| Previous Owner | Boudreault Stephen M | $0 |
Source: Public Records
Tax History
| Year | Tax Paid | Tax Assessment Tax Assessment Total Assessment is a certain percentage of the fair market value that is determined by local assessors to be the total taxable value of land and additions on the property. | Land | Improvement |
|---|---|---|---|---|
| 2025 | $6,332 | $576,200 | $327,600 | $248,600 |
| 2024 | $6,173 | $555,600 | $310,100 | $245,500 |
| 2023 | $5,906 | $502,600 | $280,800 | $221,800 |
| 2022 | $5,500 | $434,400 | $234,000 | $200,400 |
| 2021 | $5,057 | $378,800 | $212,000 | $166,800 |
| 2020 | $5,189 | $397,300 | $230,500 | $166,800 |
| 2019 | $5,012 | $377,400 | $210,600 | $166,800 |
| 2018 | $8,248 | $349,300 | $202,400 | $146,900 |
| 2017 | $4,659 | $328,300 | $183,700 | $144,600 |
| 2016 | $4,436 | $312,400 | $175,500 | $136,900 |
| 2015 | $4,088 | $274,200 | $152,100 | $122,100 |
Source: Public Records
Map
Nearby Homes
- 11 Spring St
- 2 Iroquois Rd
- 102 Centre St
- 78 North St
- 200 North St Unit 31A
- 4 Chatham Ln
- 103 Newbury St Unit 1
- 40 Village Rd Unit 1210
- 40 Village Rd Unit 1006
- 466 Newbury St Unit 20
- 98 Newbury St Unit 18B
- 98 Newbury St Unit 23B
- 6 Venice St Unit B3
- 38 Village Rd Unit 515
- 36 Village Rd Unit 603
- 36 Village Rd Unit 506
- 22 Maple Ave
- 10 Clark St
- 43 Hobart St Unit B
- 35 Locust St Unit 3
Your Personal Tour Guide
Ask me questions while you tour the home.