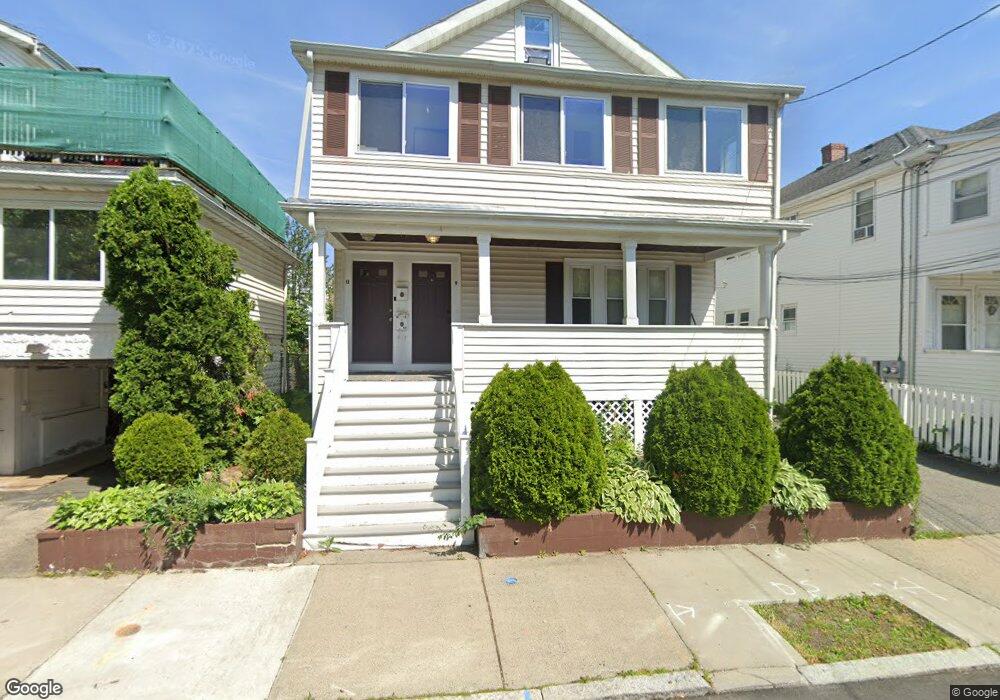
9 Durso Ave Unit 11 Malden, MA 02148
Maplewood NeighborhoodEstimated Value: $813,638 - $1,089,000
4
Beds
2
Baths
2,223
Sq Ft
$415/Sq Ft
Est. Value
About This Home
This home is located at 9 Durso Ave Unit 11, Malden, MA 02148 and is currently estimated at $921,910, approximately $414 per square foot. 9 Durso Ave Unit 11 is a home located in Middlesex County with nearby schools including Malden High School, Cheverus Catholic School, and Malden Catholic.
Ownership History
Date
Name
Owned For
Owner Type
Purchase Details
Closed on
Jun 7, 2021
Sold by
Lajoie Mertisme and Lajoie Cremene
Bought by
Lubin Stephanie
Current Estimated Value
Home Financials for this Owner
Home Financials are based on the most recent Mortgage that was taken out on this home.
Original Mortgage
$628,306
Outstanding Balance
$568,853
Interest Rate
2.9%
Mortgage Type
FHA
Estimated Equity
$353,057
Purchase Details
Closed on
Jul 12, 2002
Sold by
Lassard Laura
Bought by
Lajoie Mertisme and Lajoie Cremene
Home Financials for this Owner
Home Financials are based on the most recent Mortgage that was taken out on this home.
Original Mortgage
$338,451
Interest Rate
6.79%
Mortgage Type
Purchase Money Mortgage
Create a Home Valuation Report for This Property
The Home Valuation Report is an in-depth analysis detailing your home's value as well as a comparison with similar homes in the area
Home Values in the Area
Average Home Value in this Area
Purchase History
| Date | Buyer | Sale Price | Title Company |
|---|---|---|---|
| Lubin Stephanie | $650,000 | None Available | |
| Lajoie Mertisme | $356,000 | -- |
Source: Public Records
Mortgage History
| Date | Status | Borrower | Loan Amount |
|---|---|---|---|
| Open | Lubin Stephanie | $628,306 | |
| Previous Owner | Lajoie Mertisme | $338,451 |
Source: Public Records
Tax History Compared to Growth
Tax History
| Year | Tax Paid | Tax Assessment Tax Assessment Total Assessment is a certain percentage of the fair market value that is determined by local assessors to be the total taxable value of land and additions on the property. | Land | Improvement |
|---|---|---|---|---|
| 2025 | $80 | $704,900 | $297,500 | $407,400 |
| 2024 | $7,754 | $663,300 | $281,400 | $381,900 |
| 2023 | $7,497 | $615,000 | $257,300 | $357,700 |
| 2022 | $7,536 | $610,200 | $233,200 | $377,000 |
| 2021 | $7,252 | $590,100 | $213,100 | $377,000 |
| 2020 | $7,007 | $553,900 | $202,600 | $351,300 |
| 2019 | $6,687 | $503,900 | $193,000 | $310,900 |
| 2018 | $6,443 | $457,300 | $162,800 | $294,500 |
| 2017 | $6,293 | $444,100 | $162,800 | $281,300 |
| 2016 | $6,062 | $399,900 | $154,800 | $245,100 |
| 2015 | $5,814 | $369,600 | $145,900 | $223,700 |
| 2014 | $5,426 | $337,000 | $132,700 | $204,300 |
Source: Public Records
Map
Nearby Homes
- 363 Broadway
- 48 Summit St
- 115 Webster St
- 98 Summit St
- 26 Webber St Unit 1
- 1135 Salem St
- 19 Bellvale St
- 7 Sawyer Ct
- 10 Birch Ln
- 0 Beachview Ave
- 36 Central Ave
- 33 Lodgen Ct Unit 4G
- 82 Elwell St
- 15 Mount Washington Ave
- 4 Anderson Way Unit 2
- 44 Loomis St Unit 209
- 188-190 Sylvan St
- 31 Preston St
- 33 Blaine St
- 59 Dexter Rd
- 9 Durso Ave Unit 2
- 9-11 Durso Ave Unit 1
- 9 Durso Ave Unit 1
- 13 Durso Ave Unit 15
- 13 Durso Ave
- 13-15 Durso Ave Unit 2
- 13 Durso Ave Unit 1
- 17 Durso Ave Unit 19
- 12 Durso Ave
- 12 Durso Ave Unit SF
- 8 Durso Ave Unit 10
- 10 Durso Ave Unit 2
- 10 Durso Ave
- 362 Broadway
- 25 Durso Ave
- 18 Durso Ave Unit 20
- 20 Durso Ave Unit 2
- 18 Durso Ave Unit 1
- 20 Durso Ave
- 18-20 Durso Ave