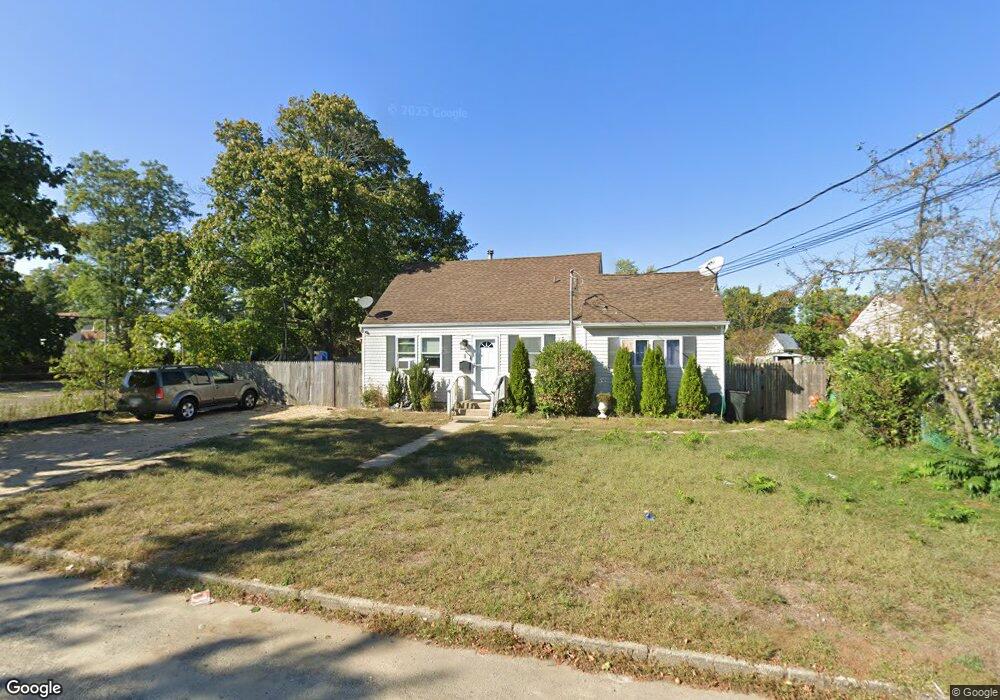
9 E Cedar St Central Islip, NY 11722
Estimated Value: $551,000 - $591,000
Studio
--
Bath
1,248
Sq Ft
$460/Sq Ft
Est. Value
About This Home
This home is located at 9 E Cedar St, Central Islip, NY 11722 and is currently estimated at $573,716, approximately $459 per square foot. 9 E Cedar St is a home located in Suffolk County with nearby schools including Anthony Alfano Elementary School and Central Islip Senior High School.
Ownership History
Date
Name
Owned For
Owner Type
Purchase Details
Closed on
Mar 12, 2022
Sold by
Brennan Giovanna
Bought by
9 East Cedar Llc
Current Estimated Value
Home Financials for this Owner
Home Financials are based on the most recent Mortgage that was taken out on this home.
Original Mortgage
$292,500
Outstanding Balance
$272,571
Interest Rate
3.69%
Mortgage Type
Stand Alone Refi Refinance Of Original Loan
Estimated Equity
$301,145
Purchase Details
Closed on
Jul 14, 2017
Sold by
Brennan David
Bought by
Brennan Giovanna
Purchase Details
Closed on
Jun 24, 2014
Sold by
Matrix Equities Inc
Bought by
Brennan David
Purchase Details
Closed on
Nov 20, 2008
Sold by
Trustee Wells Fargo Bank
Bought by
Matrix Equities Inc
Create a Home Valuation Report for This Property
The Home Valuation Report is an in-depth analysis detailing your home's value as well as a comparison with similar homes in the area
Home Values in the Area
Average Home Value in this Area
Purchase History
| Date | Buyer | Sale Price | Title Company |
|---|---|---|---|
| 9 East Cedar Llc | -- | None Available | |
| 9 East Cedar Llc | -- | None Available | |
| Brennan Giovanna | -- | None Available | |
| Brennan Giovanna | -- | None Available | |
| Brennan David | $85,000 | -- | |
| Brennan David | $85,000 | -- | |
| Matrix Equities Inc | $134,536 | George Patsis | |
| Matrix Equities Inc | $134,536 | George Patsis |
Source: Public Records
Mortgage History
| Date | Status | Borrower | Loan Amount |
|---|---|---|---|
| Open | 9 East Cedar Llc | $292,500 | |
| Closed | 9 East Cedar Llc | $292,500 |
Source: Public Records
Tax History
| Year | Tax Paid | Tax Assessment Tax Assessment Total Assessment is a certain percentage of the fair market value that is determined by local assessors to be the total taxable value of land and additions on the property. | Land | Improvement |
|---|---|---|---|---|
| 2024 | -- | $26,900 | $5,600 | $21,300 |
| 2023 | -- | $26,900 | $5,600 | $21,300 |
| 2022 | $8,119 | $26,900 | $5,600 | $21,300 |
| 2021 | $8,119 | $26,900 | $5,600 | $21,300 |
| 2020 | $7,654 | $26,900 | $5,600 | $21,300 |
| 2019 | $8,119 | $0 | $0 | $0 |
| 2018 | -- | $26,900 | $5,600 | $21,300 |
| 2017 | $8,235 | $26,900 | $5,600 | $21,300 |
| 2016 | $8,170 | $26,900 | $5,600 | $21,300 |
| 2015 | -- | $26,900 | $5,600 | $21,300 |
| 2014 | -- | $26,900 | $5,600 | $21,300 |
Source: Public Records
Map
Nearby Homes
- 14 E Walnut St
- 21 E Walnut St
- 16 E Chestnut St
- 13 Poplar St
- 0 Poplar St
- 39 E Walnut St
- 138 Weatherby Ln Unit 138
- 27 Ash St
- 37 E Maple St
- 37 Weatherby Ln
- 11 Hunter Dr
- 28 Hemlock St
- 115 Weatherby Ln
- 106 Northwood Blvd
- 33 E Cherry St
- 410 Elmore St
- 100 Weatherby Ln Unit 100
- 96 Somerton Ave
- 40 E Cherry St
- 345 Elmore St
Your Personal Tour Guide
Ask me questions while you tour the home.