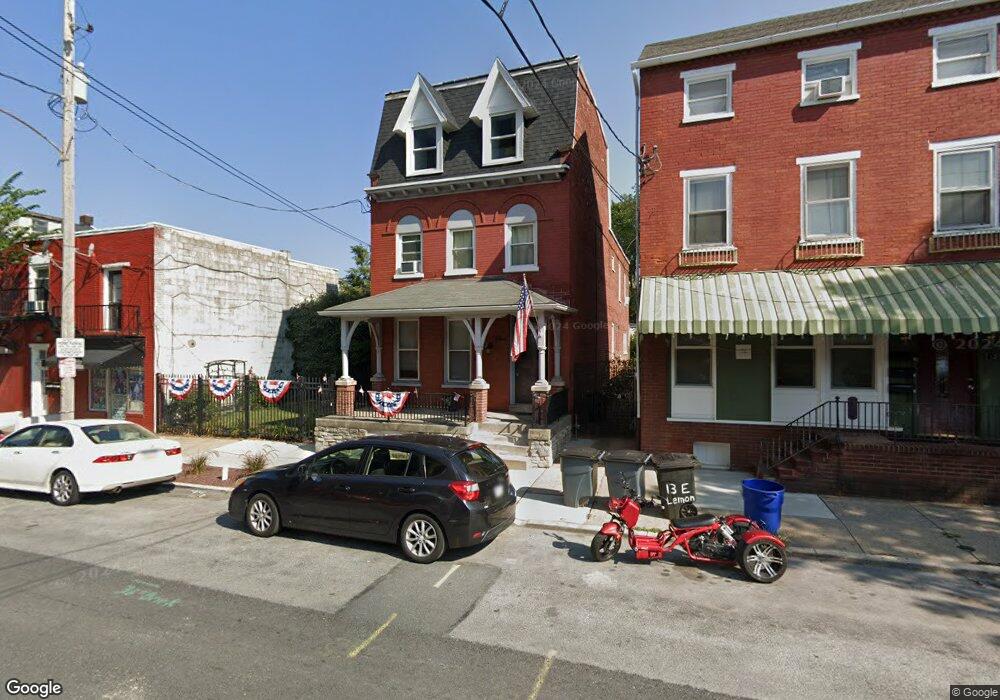
9 E Lemon St Lancaster, PA 17602
Downtown Lancaster NeighborhoodEstimated Value: $442,000 - $506,000
4
Beds
4
Baths
2,953
Sq Ft
$161/Sq Ft
Est. Value
About This Home
This home is located at 9 E Lemon St, Lancaster, PA 17602 and is currently estimated at $475,873, approximately $161 per square foot. 9 E Lemon St is a home located in Lancaster County with nearby schools including Ross Elementary School, Reynolds Middle School, and McCaskey High School.
Ownership History
Date
Name
Owned For
Owner Type
Purchase Details
Closed on
Jan 14, 2003
Sold by
Riger David and Riger Sandra J
Bought by
Struck James J
Current Estimated Value
Home Financials for this Owner
Home Financials are based on the most recent Mortgage that was taken out on this home.
Original Mortgage
$95,000
Interest Rate
5.9%
Purchase Details
Closed on
Sep 3, 1998
Sold by
Longo Anthony J and Murray Karole A
Bought by
Riger David and Riger Sandra J
Home Financials for this Owner
Home Financials are based on the most recent Mortgage that was taken out on this home.
Original Mortgage
$103,000
Interest Rate
6.9%
Create a Home Valuation Report for This Property
The Home Valuation Report is an in-depth analysis detailing your home's value as well as a comparison with similar homes in the area
Home Values in the Area
Average Home Value in this Area
Purchase History
| Date | Buyer | Sale Price | Title Company |
|---|---|---|---|
| Struck James J | $125,000 | -- | |
| Riger David | $114,900 | -- |
Source: Public Records
Mortgage History
| Date | Status | Borrower | Loan Amount |
|---|---|---|---|
| Previous Owner | Struck James J | $95,000 | |
| Previous Owner | Riger David | $103,000 |
Source: Public Records
Tax History
| Year | Tax Paid | Tax Assessment Tax Assessment Total Assessment is a certain percentage of the fair market value that is determined by local assessors to be the total taxable value of land and additions on the property. | Land | Improvement |
|---|---|---|---|---|
| 2025 | $7,241 | $183,000 | $29,900 | $153,100 |
| 2024 | $7,241 | $183,000 | $29,900 | $153,100 |
| 2023 | $7,119 | $183,000 | $29,900 | $153,100 |
| 2022 | $6,823 | $183,000 | $29,900 | $153,100 |
| 2021 | $6,677 | $183,000 | $29,900 | $153,100 |
| 2020 | $6,677 | $183,000 | $29,900 | $153,100 |
| 2019 | $6,577 | $183,000 | $29,900 | $153,100 |
| 2018 | $7,662 | $183,000 | $29,900 | $153,100 |
| 2017 | $5,471 | $119,100 | $17,200 | $101,900 |
| 2016 | $5,420 | $119,100 | $17,200 | $101,900 |
| 2015 | $2,115 | $119,100 | $17,200 | $101,900 |
| 2014 | $4,731 | $119,100 | $17,200 | $101,900 |
Source: Public Records
Map
Nearby Homes
- 413 N Queen St
- 440 1/2 N Water St
- 218 E Madison St
- 626 N Duke St
- 128 E New St
- 305 W Lemon St
- 13 E New St
- 442 N Mulberry St
- 701 703 N Duke St
- 101 N Queen St Unit 412
- 101 N Queen St Unit 407
- 101 N Queen St Unit 414
- 101 N Queen St Unit 404
- 27 W New St
- 716 N Lime St
- 110 W Orange St
- 235 E New St
- 550 N Plum St
- 830 N Duke St
- 596 N Plum St
- 13 E Lemon St
- 15 E Lemon St
- 405 N Queen St
- 401 N Queen St
- 17 E Lemon St
- 19 E Lemon St
- 415 N Queen St
- 14 E Lemon St Unit B336E
- 21 E Lemon St
- 16 E Lemon St
- 417 N Queen St
- 18 E Lemon St Unit B336E
- 23 E Lemon St
- 20 E Lemon St
- 416 N Christian St
- 347 N Queen St
- 419 N Queen St Unit 1N
- 419 N Queen St
- 419 N Queen St Unit 3
- 419 N Queen St Unit 2S
Your Personal Tour Guide
Ask me questions while you tour the home.