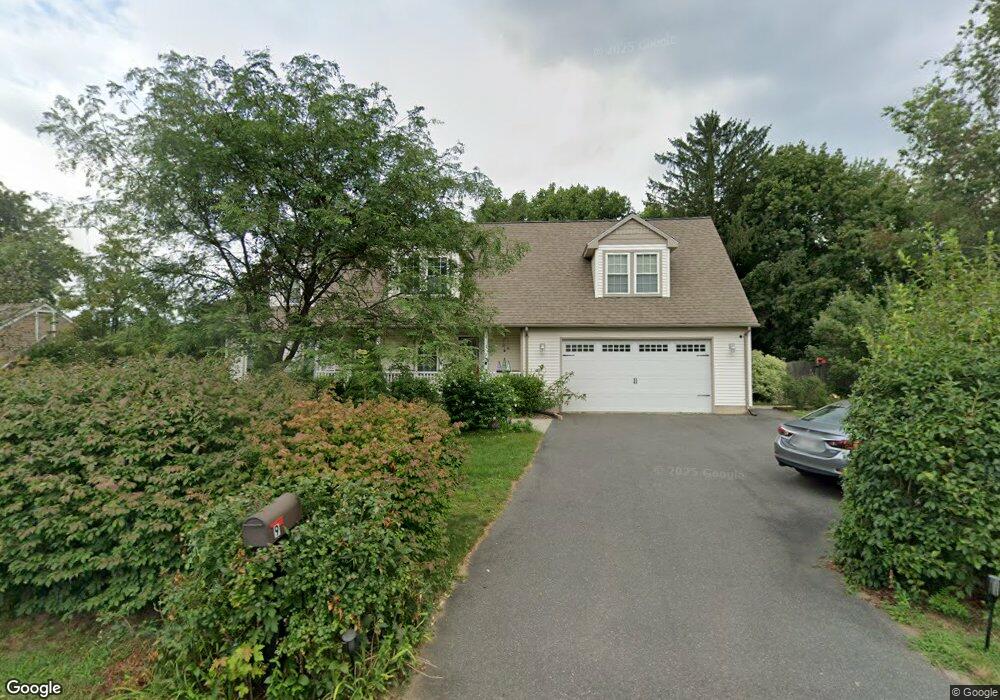
9 E Maple St Easthampton, MA 01027
Estimated Value: $567,000 - $647,000
4
Beds
3
Baths
2,243
Sq Ft
$273/Sq Ft
Est. Value
About This Home
This home is located at 9 E Maple St, Easthampton, MA 01027 and is currently estimated at $611,388, approximately $272 per square foot. 9 E Maple St is a home located in Hampshire County with nearby schools including Easthampton High School, Hilltown Cooperative Charter Public School, and Tri-County Schools.
Ownership History
Date
Name
Owned For
Owner Type
Purchase Details
Closed on
Apr 28, 2005
Sold by
Autumn Prop Llc
Bought by
Powers Charles B and Moran Amy E
Current Estimated Value
Home Financials for this Owner
Home Financials are based on the most recent Mortgage that was taken out on this home.
Original Mortgage
$160,000
Interest Rate
5.95%
Mortgage Type
Purchase Money Mortgage
Create a Home Valuation Report for This Property
The Home Valuation Report is an in-depth analysis detailing your home's value as well as a comparison with similar homes in the area
Home Values in the Area
Average Home Value in this Area
Purchase History
| Date | Buyer | Sale Price | Title Company |
|---|---|---|---|
| Powers Charles B | $335,500 | -- |
Source: Public Records
Mortgage History
| Date | Status | Borrower | Loan Amount |
|---|---|---|---|
| Open | Powers Charles B | $155,000 | |
| Closed | Powers Charles B | $123,000 | |
| Closed | Powers Charles B | $115,000 | |
| Closed | Powers Charles B | $160,000 |
Source: Public Records
Tax History
| Year | Tax Paid | Tax Assessment Tax Assessment Total Assessment is a certain percentage of the fair market value that is determined by local assessors to be the total taxable value of land and additions on the property. | Land | Improvement |
|---|---|---|---|---|
| 2025 | $7,520 | $550,100 | $109,700 | $440,400 |
| 2024 | $7,267 | $535,900 | $106,500 | $429,400 |
| 2023 | $5,371 | $366,600 | $83,700 | $282,900 |
| 2022 | $6,060 | $366,600 | $83,700 | $282,900 |
| 2021 | $6,721 | $383,200 | $83,700 | $299,500 |
| 2020 | $6,511 | $366,600 | $83,700 | $282,900 |
| 2019 | $5,493 | $355,300 | $83,700 | $271,600 |
| 2018 | $5,293 | $330,800 | $78,900 | $251,900 |
| 2017 | $5,176 | $319,300 | $75,900 | $243,400 |
| 2016 | $5,022 | $322,100 | $75,900 | $246,200 |
| 2015 | $4,880 | $322,100 | $75,900 | $246,200 |
Source: Public Records
Map
Nearby Homes
- 2 Oak St
- 33 Knipfer Ave
- 12 Glen Cove Place Unit B
- 10 Glen Cove Place Unit A
- 19 Mount Tom Ave Unit 19
- 19 Nicols Way Unit 19
- 11 Dragon Cir
- 36 & 36R Holly Cir
- 41 South St Unit 11
- 6 S St & Abutting Lots
- 385 Main St
- 2 W Park Dr
- M143 &152 Glendale St
- 131 West St Unit 131
- 245 Park St
- 457 Northampton St
- Lot 1 Edgewater Ln
- 4 Laurel Dr
- 29 Sandra Rd
- 296 Old Wilson Rd
Your Personal Tour Guide
Ask me questions while you tour the home.