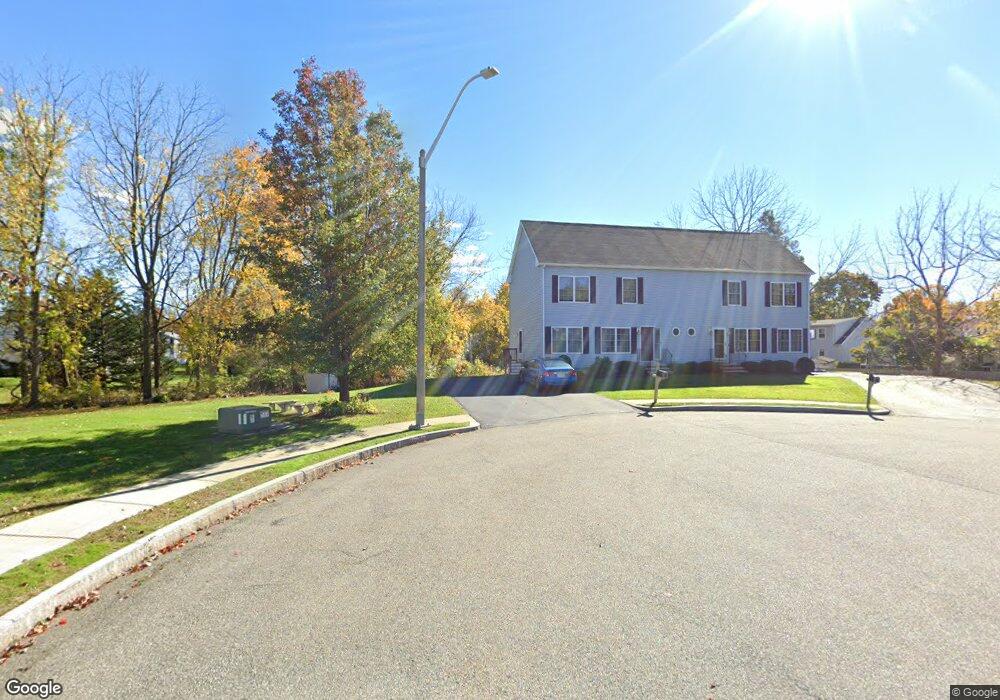
9 Earl Stokes Cir Unit 2 Woburn, MA 01801
North Woburn NeighborhoodEstimated Value: $658,000 - $764,000
3
Beds
3
Baths
1,486
Sq Ft
$483/Sq Ft
Est. Value
About This Home
This home is located at 9 Earl Stokes Cir Unit 2, Woburn, MA 01801 and is currently estimated at $718,435, approximately $483 per square foot. 9 Earl Stokes Cir Unit 2 is a home located in Middlesex County with nearby schools including Linscott-Rumford Elementary School, John F. Kennedy Middle School, and Woburn High School.
Ownership History
Date
Name
Owned For
Owner Type
Purchase Details
Closed on
Oct 4, 2022
Sold by
Fayad Ralph and Fayad Elham
Bought by
Amatya Nilesh
Current Estimated Value
Home Financials for this Owner
Home Financials are based on the most recent Mortgage that was taken out on this home.
Original Mortgage
$617,500
Outstanding Balance
$583,876
Interest Rate
3.88%
Mortgage Type
Purchase Money Mortgage
Estimated Equity
$134,559
Purchase Details
Closed on
Dec 1, 2003
Sold by
32 Webster St Rt
Bought by
Rayad Ralph and Fayad Elham
Home Financials for this Owner
Home Financials are based on the most recent Mortgage that was taken out on this home.
Original Mortgage
$215,000
Interest Rate
6.09%
Mortgage Type
Purchase Money Mortgage
Create a Home Valuation Report for This Property
The Home Valuation Report is an in-depth analysis detailing your home's value as well as a comparison with similar homes in the area
Home Values in the Area
Average Home Value in this Area
Purchase History
| Date | Buyer | Sale Price | Title Company |
|---|---|---|---|
| Amatya Nilesh | $650,000 | None Available | |
| Amatya Nilesh | $650,000 | None Available | |
| Rayad Ralph | $341,900 | -- |
Source: Public Records
Mortgage History
| Date | Status | Borrower | Loan Amount |
|---|---|---|---|
| Open | Amatya Nilesh | $617,500 | |
| Closed | Amatya Nilesh | $617,500 | |
| Previous Owner | Rayad Ralph | $215,000 |
Source: Public Records
Tax History Compared to Growth
Tax History
| Year | Tax Paid | Tax Assessment Tax Assessment Total Assessment is a certain percentage of the fair market value that is determined by local assessors to be the total taxable value of land and additions on the property. | Land | Improvement |
|---|---|---|---|---|
| 2025 | $4,607 | $539,500 | $0 | $539,500 |
| 2024 | $4,184 | $519,100 | $0 | $519,100 |
| 2023 | $4,326 | $497,200 | $0 | $497,200 |
| 2022 | $4,376 | $468,500 | $0 | $468,500 |
| 2021 | $4,244 | $454,900 | $0 | $454,900 |
| 2020 | $4,200 | $450,600 | $0 | $450,600 |
| 2019 | $4,016 | $422,700 | $0 | $422,700 |
| 2018 | $3,953 | $399,700 | $0 | $399,700 |
| 2017 | $3,696 | $371,800 | $0 | $371,800 |
| 2016 | $3,461 | $344,400 | $0 | $344,400 |
| 2015 | $3,353 | $329,700 | $0 | $329,700 |
| 2014 | $3,400 | $325,700 | $0 | $325,700 |
Source: Public Records
Map
Nearby Homes
- 9 Earl Stokes Cir Unit 1
- 9 Earl Stokes Cir Unit 9
- 10 Earl Stokes Cir Unit 2
- 9 Kendal Dr
- 7 Kendal Dr
- 11 Kendal Dr
- 13 Kendal Dr
- 5 Hailey Way
- 9 Mikaila Way
- 7 Mikaila Way
- 7 Mikaila Way
- 7 Mikaila Way Unit 7
- 5 Kendal Dr
- 14 Edwards Rd Unit A
- 14 Edwards Rd
- 4 Kendal Dr
- 4 Kendal Dr
- 15 Kendal Dr
- 7 Earl Stokes Cir
- 5 Earl Stokes Cir Unit 2