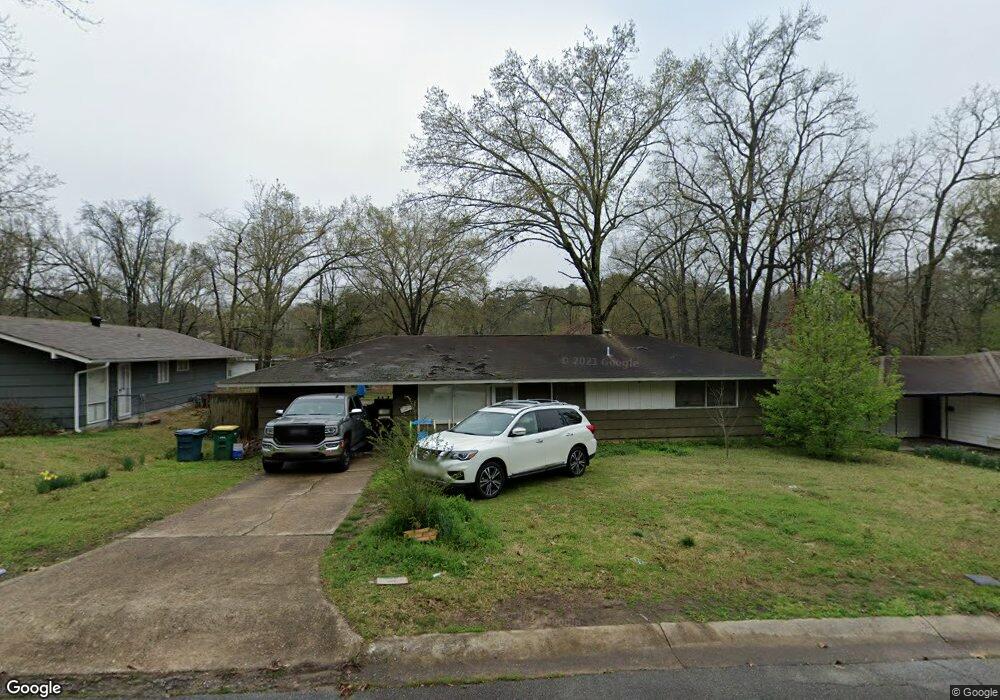
9 Edgemont Dr Little Rock, AR 72209
65th Street West NeighborhoodEstimated Value: $102,000 - $143,000
2
Beds
2
Baths
1,104
Sq Ft
$105/Sq Ft
Est. Value
About This Home
This home is located at 9 Edgemont Dr, Little Rock, AR 72209 and is currently estimated at $116,000, approximately $105 per square foot. 9 Edgemont Dr is a home located in Pulaski County with nearby schools including Mabelvale Middle School, Little Rock Southwest High School, and Exalt Academy of Southwest Little Rock.
Ownership History
Date
Name
Owned For
Owner Type
Purchase Details
Closed on
Sep 24, 2021
Sold by
Lane Matthew
Bought by
M & J Lane Investments Llc
Current Estimated Value
Purchase Details
Closed on
Mar 31, 2014
Sold by
Lane Matthew
Bought by
Gonzalez Vicky
Home Financials for this Owner
Home Financials are based on the most recent Mortgage that was taken out on this home.
Original Mortgage
$73,000
Outstanding Balance
$21,926
Interest Rate
7.75%
Mortgage Type
Seller Take Back
Estimated Equity
$94,074
Purchase Details
Closed on
Aug 17, 2011
Sold by
Muirhead Sharyn A
Bought by
Lane Matthew
Home Financials for this Owner
Home Financials are based on the most recent Mortgage that was taken out on this home.
Original Mortgage
$39,950
Interest Rate
4.58%
Mortgage Type
Future Advance Clause Open End Mortgage
Purchase Details
Closed on
Apr 19, 2005
Sold by
Stoll Herman O
Bought by
Stoll Herman O and Muirhead Sharyn A
Create a Home Valuation Report for This Property
The Home Valuation Report is an in-depth analysis detailing your home's value as well as a comparison with similar homes in the area
Home Values in the Area
Average Home Value in this Area
Purchase History
| Date | Buyer | Sale Price | Title Company |
|---|---|---|---|
| M & J Lane Investments Llc | -- | American Abstract & Title Co | |
| Gonzalez Vicky | $78,000 | None Available | |
| Lane Matthew | $48,000 | American Abstract & Title Co | |
| Stoll Herman O | -- | Capitol Title Co Inc |
Source: Public Records
Mortgage History
| Date | Status | Borrower | Loan Amount |
|---|---|---|---|
| Open | Gonzalez Vicky | $73,000 | |
| Closed | Lane Matthew | $39,950 |
Source: Public Records
Tax History Compared to Growth
Tax History
| Year | Tax Paid | Tax Assessment Tax Assessment Total Assessment is a certain percentage of the fair market value that is determined by local assessors to be the total taxable value of land and additions on the property. | Land | Improvement |
|---|---|---|---|---|
| 2025 | $863 | $14,644 | $2,600 | $12,044 |
| 2024 | $740 | $14,644 | $2,600 | $12,044 |
| 2023 | $740 | $14,644 | $2,600 | $12,044 |
| 2022 | $678 | $14,644 | $2,600 | $12,044 |
| 2021 | $621 | $8,810 | $900 | $7,910 |
| 2020 | $242 | $8,810 | $900 | $7,910 |
| 2019 | $242 | $8,810 | $900 | $7,910 |
| 2018 | $267 | $8,810 | $900 | $7,910 |
| 2017 | $267 | $8,810 | $900 | $7,910 |
| 2016 | $438 | $11,260 | $2,600 | $8,660 |
| 2015 | $789 | $11,260 | $2,600 | $8,660 |
| 2014 | $789 | $11,260 | $2,600 | $8,660 |
Source: Public Records
Map
Nearby Homes
- 27 Westmont Cir
- 48 Westmont Cir
- 1 W Windsor Dr
- 22 Lamont Dr
- 5 Delrose Dr
- 15 Lamont Dr
- 11 Lamont Dr
- 35 Windsor Dr
- 17 Belmar Dr
- 40 W Windsor Dr
- 29 Rosewood Dr
- TBD Cardinal Rd
- 00 S University Ave
- 5900-5908 Geyer Springs
- 8012 Westwood Ave
- 5116 Nancy Ct
- 7317 Mabelvale Pike
- 5223 Mabelvale Pike
- 7102 Geyer Springs Rd
- Lot 53 Block 5 Westwood Ave
- 0 Edgemont Dr
- 7 Edgemont Dr
- 84 S Meadowcliff Dr
- 82 S Meadowcliff Dr
- 86 S Meadowcliff Dr
- 5 Edgemont Dr
- 15 Edgemont Dr
- 6 Edgemont Dr
- 8 Edgemont Dr
- 80 S Meadowcliff Dr
- 88 S Meadowcliff Dr
- 4 Edgemont Dr
- 10 Edgemont Dr
- 17 Edgemont Dr
- 3 Edgemont Dr
- 12 Edgemont Dr
- 90 S Meadowcliff Dr
- 78 S Meadowcliff Dr
- 2 Edgemont Dr
- 87 S Meadowcliff Dr