9 Edgewood Ct Orinda, CA 94563
Estimated Value: $1,732,000 - $1,930,059
3
Beds
2
Baths
2,501
Sq Ft
$732/Sq Ft
Est. Value
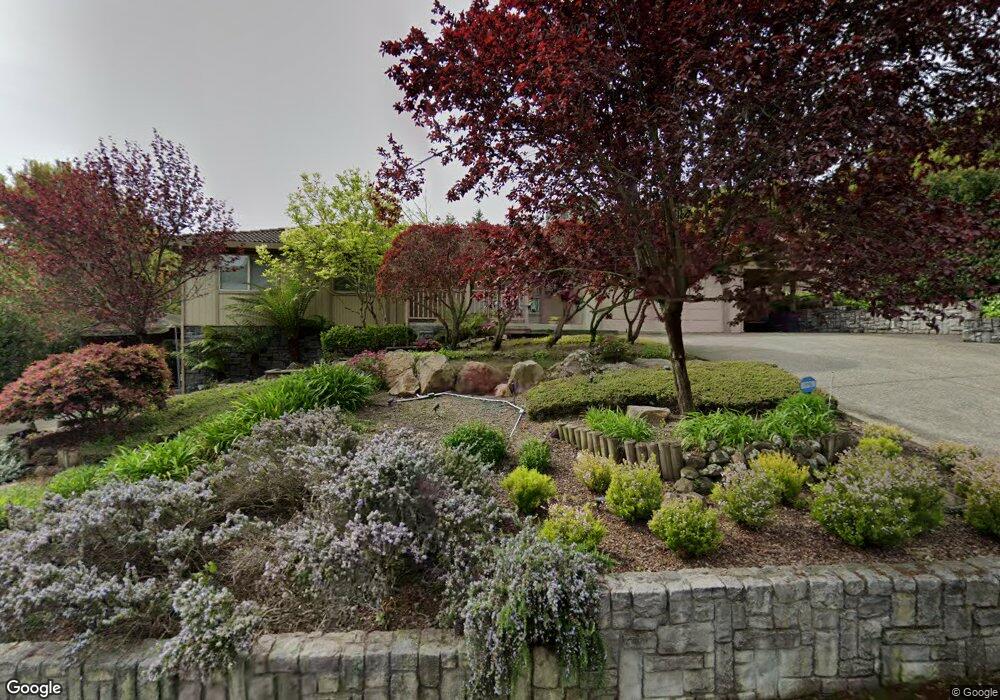
About This Home
This home is located at 9 Edgewood Ct, Orinda, CA 94563 and is currently estimated at $1,831,515, approximately $732 per square foot. 9 Edgewood Ct is a home located in Contra Costa County with nearby schools including Del Rey Elementary School, Orinda Intermediate School, and Miramonte High School.
Ownership History
Date
Name
Owned For
Owner Type
Purchase Details
Closed on
Jul 24, 2024
Sold by
Nunes-Rickett Living Trust and Rickett Robert R
Bought by
Nunes-Rickett Survivors Trust and Nunes-Rickett Bypass Trust
Current Estimated Value
Purchase Details
Closed on
Jun 10, 2016
Sold by
Rickett Robert R and Nunes Norman G
Bought by
Rickett Robert R and Nunes Norman G
Purchase Details
Closed on
Apr 24, 2012
Sold by
Rickett Robert R and Nunes Norman G
Bought by
Rickett Robert R and Nunes Norman G
Home Financials for this Owner
Home Financials are based on the most recent Mortgage that was taken out on this home.
Original Mortgage
$360,000
Interest Rate
3.86%
Mortgage Type
New Conventional
Purchase Details
Closed on
Mar 17, 1994
Sold by
Rickett Robert R
Bought by
Rickett Robert R and Nunes Norman G
Create a Home Valuation Report for This Property
The Home Valuation Report is an in-depth analysis detailing your home's value as well as a comparison with similar homes in the area
Home Values in the Area
Average Home Value in this Area
Purchase History
| Date | Buyer | Sale Price | Title Company |
|---|---|---|---|
| Nunes-Rickett Survivors Trust | -- | None Listed On Document | |
| Rickett Robert R | -- | None Available | |
| Rickett Robert R | -- | None Available | |
| Rickett Robert R | -- | Chicago Title Company | |
| Rickett Robert R | -- | -- |
Source: Public Records
Mortgage History
| Date | Status | Borrower | Loan Amount |
|---|---|---|---|
| Previous Owner | Rickett Robert R | $360,000 |
Source: Public Records
Tax History Compared to Growth
Tax History
| Year | Tax Paid | Tax Assessment Tax Assessment Total Assessment is a certain percentage of the fair market value that is determined by local assessors to be the total taxable value of land and additions on the property. | Land | Improvement |
|---|---|---|---|---|
| 2025 | $9,745 | $691,177 | $247,936 | $443,241 |
| 2024 | $9,585 | $677,625 | $243,075 | $434,550 |
| 2023 | $9,585 | $664,339 | $238,309 | $426,030 |
| 2022 | $9,187 | $651,314 | $233,637 | $417,677 |
| 2021 | $9,006 | $638,544 | $229,056 | $409,488 |
| 2019 | $8,871 | $619,607 | $222,263 | $397,344 |
| 2018 | $8,233 | $607,458 | $217,905 | $389,553 |
| 2017 | $7,996 | $595,548 | $213,633 | $381,915 |
| 2016 | $7,801 | $583,872 | $209,445 | $374,427 |
| 2015 | $7,748 | $575,102 | $206,299 | $368,803 |
| 2014 | $7,633 | $563,837 | $202,258 | $361,579 |
Source: Public Records
Map
Nearby Homes