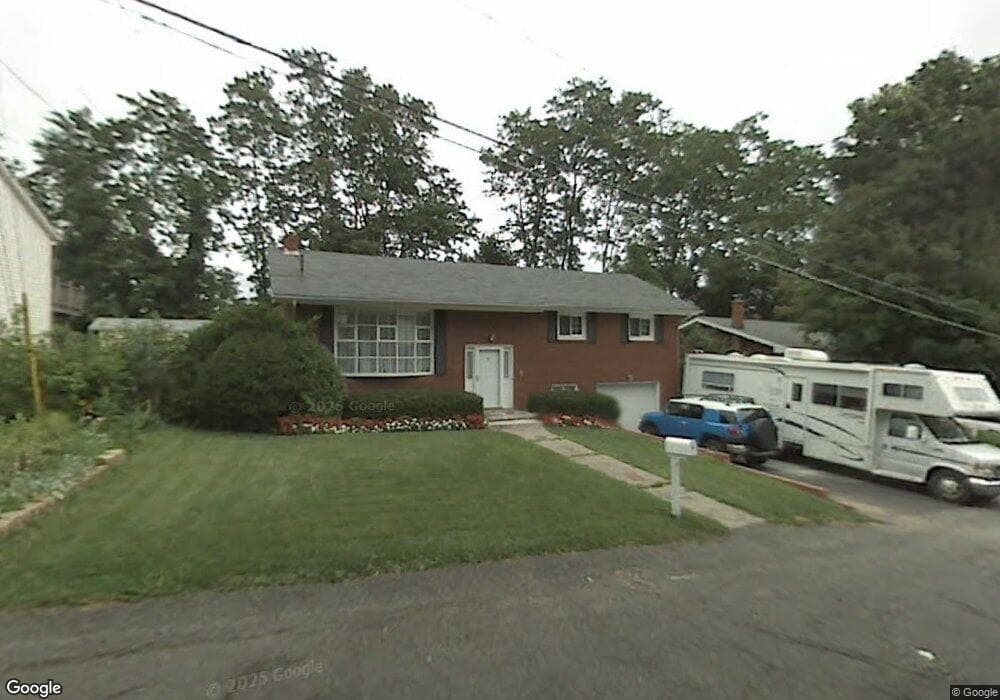
9 Eliot Ave Albany, NY 12203
Campus Area NeighborhoodEstimated Value: $323,000 - $360,592
3
Beds
2
Baths
2,052
Sq Ft
$164/Sq Ft
Est. Value
About This Home
This home is located at 9 Eliot Ave, Albany, NY 12203 and is currently estimated at $337,148, approximately $164 per square foot. 9 Eliot Ave is a home located in Albany County with nearby schools including Eagle Point Elementary School, William S Hackett Middle School, and Albany High School.
Ownership History
Date
Name
Owned For
Owner Type
Purchase Details
Closed on
Mar 14, 2012
Sold by
Rothaupt Mark J
Bought by
Rothaupt Mary Frances
Current Estimated Value
Purchase Details
Closed on
Jul 30, 2001
Sold by
Murphy Thomas K
Bought by
Rathaupt Mark
Create a Home Valuation Report for This Property
The Home Valuation Report is an in-depth analysis detailing your home's value as well as a comparison with similar homes in the area
Home Values in the Area
Average Home Value in this Area
Purchase History
| Date | Buyer | Sale Price | Title Company |
|---|---|---|---|
| Rothaupt Mary Frances | -- | None Available | |
| Rathaupt Mark | $124,000 | Paul Kanppe |
Source: Public Records
Tax History
| Year | Tax Paid | Tax Assessment Tax Assessment Total Assessment is a certain percentage of the fair market value that is determined by local assessors to be the total taxable value of land and additions on the property. | Land | Improvement |
|---|---|---|---|---|
| 2025 | $8,099 | $332,000 | $66,400 | $265,600 |
| 2024 | $8,099 | $332,000 | $66,400 | $265,600 |
| 2023 | $6,857 | $185,000 | $37,000 | $148,000 |
| 2022 | $6,629 | $185,000 | $37,000 | $148,000 |
| 2021 | $6,589 | $185,000 | $37,000 | $148,000 |
| 2020 | $6,381 | $185,000 | $37,000 | $148,000 |
| 2019 | $7,283 | $185,000 | $37,000 | $148,000 |
| 2018 | $6,386 | $185,000 | $37,000 | $148,000 |
| 2017 | $2,686 | $185,000 | $37,000 | $148,000 |
| 2016 | $6,199 | $185,000 | $37,000 | $148,000 |
| 2015 | $6,145 | $185,000 | $39,500 | $145,500 |
| 2014 | -- | $185,000 | $39,500 | $145,500 |
Source: Public Records
Map
Nearby Homes
Your Personal Tour Guide
Ask me questions while you tour the home.