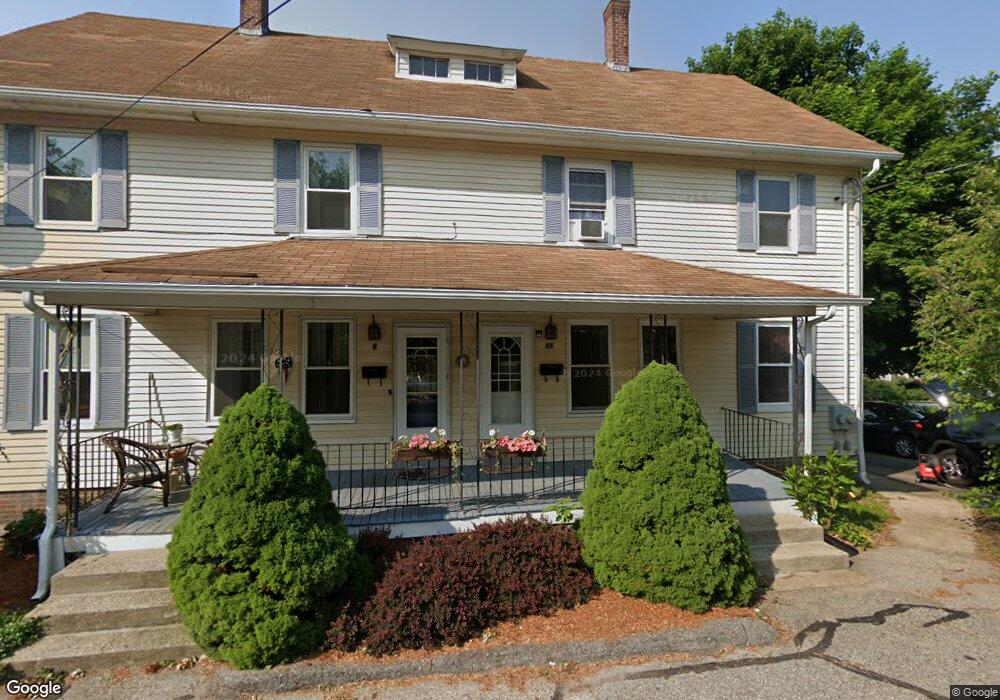
9 Elm St Whitinsville, MA 01588
Estimated Value: $280,000 - $338,000
3
Beds
2
Baths
1,218
Sq Ft
$252/Sq Ft
Est. Value
About This Home
This home is located at 9 Elm St, Whitinsville, MA 01588 and is currently estimated at $307,455, approximately $252 per square foot. 9 Elm St is a home located in Worcester County with nearby schools including Northbridge Elementary School, Northbridge Middle School, and Northbridge High School.
Ownership History
Date
Name
Owned For
Owner Type
Purchase Details
Closed on
Aug 18, 2004
Sold by
Bradley Ryan C and Bradley Sarah D
Bought by
Angell Christine M and Angell James B
Current Estimated Value
Home Financials for this Owner
Home Financials are based on the most recent Mortgage that was taken out on this home.
Original Mortgage
$204,250
Outstanding Balance
$100,046
Interest Rate
6.03%
Mortgage Type
Purchase Money Mortgage
Estimated Equity
$207,409
Purchase Details
Closed on
May 15, 2000
Sold by
Fortier Kenneth R
Bought by
Bradley Ryan C and Bradley Sarah D
Home Financials for this Owner
Home Financials are based on the most recent Mortgage that was taken out on this home.
Original Mortgage
$157,413
Interest Rate
8.21%
Mortgage Type
Purchase Money Mortgage
Purchase Details
Closed on
Feb 1, 2000
Sold by
Furlong Nancy L and Furlong Lynne E
Bought by
Fortier Kenneth R
Create a Home Valuation Report for This Property
The Home Valuation Report is an in-depth analysis detailing your home's value as well as a comparison with similar homes in the area
Home Values in the Area
Average Home Value in this Area
Purchase History
| Date | Buyer | Sale Price | Title Company |
|---|---|---|---|
| Angell Christine M | $215,000 | -- | |
| Angell Christine M | $215,000 | -- | |
| Bradley Ryan C | $157,500 | -- | |
| Bradley Ryan C | $157,500 | -- | |
| Fortier Kenneth R | $13,200 | -- | |
| Fortier Kenneth R | $13,200 | -- |
Source: Public Records
Mortgage History
| Date | Status | Borrower | Loan Amount |
|---|---|---|---|
| Open | Angell Christine M | $204,250 | |
| Closed | Fortier Kenneth R | $204,250 | |
| Previous Owner | Fortier Kenneth R | $157,413 |
Source: Public Records
Tax History Compared to Growth
Tax History
| Year | Tax Paid | Tax Assessment Tax Assessment Total Assessment is a certain percentage of the fair market value that is determined by local assessors to be the total taxable value of land and additions on the property. | Land | Improvement |
|---|---|---|---|---|
| 2025 | $3,223 | $273,400 | $0 | $273,400 |
| 2024 | $3,021 | $249,900 | $0 | $249,900 |
| 2023 | $3,035 | $234,200 | $0 | $234,200 |
| 2022 | $2,287 | $166,100 | $0 | $166,100 |
| 2021 | $2,085 | $143,900 | $0 | $143,900 |
| 2020 | $1,911 | $138,100 | $0 | $138,100 |
| 2019 | $1,716 | $132,300 | $0 | $132,300 |
| 2018 | $1,580 | $122,100 | $0 | $122,100 |
| 2017 | $1,606 | $118,700 | $0 | $118,700 |
| 2016 | $1,632 | $118,700 | $0 | $118,700 |
| 2015 | $1,588 | $118,700 | $0 | $118,700 |
| 2014 | $1,526 | $115,100 | $0 | $115,100 |
Source: Public Records
Map
Nearby Homes
- 1 Elm St
- 9 Banning Dr
- 128 Linwood Ave
- Lots 1-9 Spring St
- 18 East St Unit 24
- 99 Country Club Dr
- 121 East St Unit 121
- 21 Granite St
- 90 Nathaniel Dr
- 5 Summit St
- 111 Windsor Ridge Dr
- 237 Heritage Dr Unit 237
- 22 Bayliss Way
- 3 Bayliss Way
- 26 Bayliss Way
- 11 A St Unit 11
- 894 Marston Rd
- 24 Crescent St Unit 6
- 235 Rivulet St
- 94 Heritage Dr Unit 94