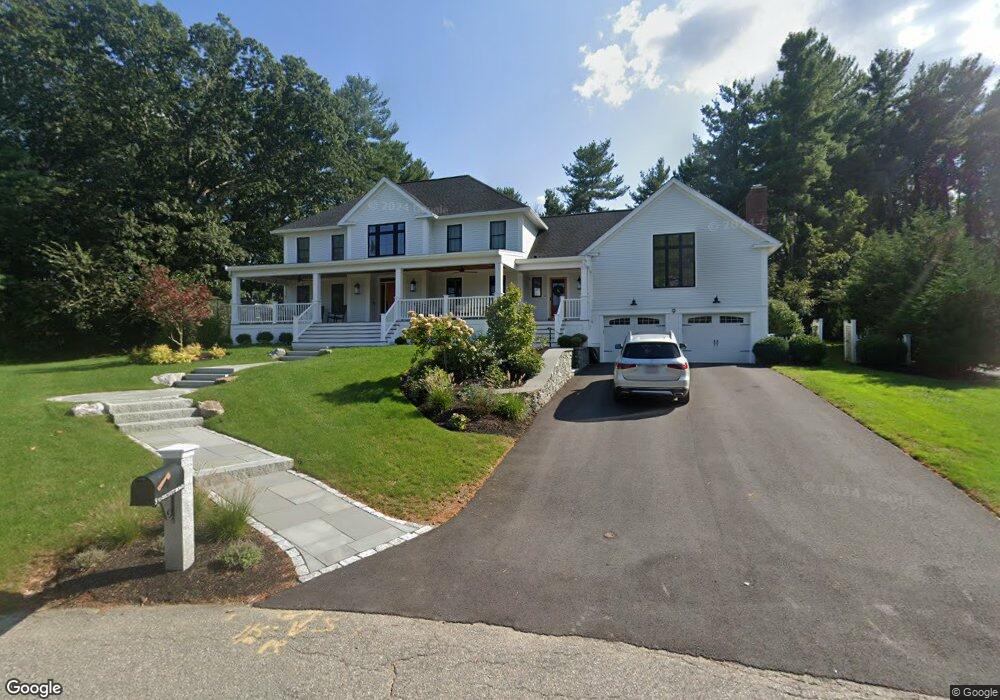
9 Endicott Rd Andover, MA 01810
Shawsheen Heights NeighborhoodEstimated Value: $1,489,000 - $1,956,000
4
Beds
4
Baths
4,719
Sq Ft
$356/Sq Ft
Est. Value
About This Home
This home is located at 9 Endicott Rd, Andover, MA 01810 and is currently estimated at $1,680,691, approximately $356 per square foot. 9 Endicott Rd is a home located in Essex County with nearby schools including West Elementary School, Andover West Middle School, and Andover High School.
Ownership History
Date
Name
Owned For
Owner Type
Purchase Details
Closed on
Sep 30, 2016
Sold by
Doherty James D and Doherty Mary B
Bought by
Forde Aidan and Forde Lea
Current Estimated Value
Purchase Details
Closed on
Oct 31, 2001
Sold by
Vandeberghe Vincent and Woolecamp Veerle
Bought by
Doherty James D and Doherty Mary Beth
Home Financials for this Owner
Home Financials are based on the most recent Mortgage that was taken out on this home.
Original Mortgage
$500,000
Interest Rate
6.82%
Mortgage Type
Purchase Money Mortgage
Purchase Details
Closed on
Aug 6, 1993
Sold by
Paine James S
Bought by
Vandenberghe Vincent
Purchase Details
Closed on
Jun 27, 1991
Sold by
Ca Investment Tr
Bought by
Paine James S
Create a Home Valuation Report for This Property
The Home Valuation Report is an in-depth analysis detailing your home's value as well as a comparison with similar homes in the area
Home Values in the Area
Average Home Value in this Area
Purchase History
| Date | Buyer | Sale Price | Title Company |
|---|---|---|---|
| Forde Aidan | $1,030,000 | -- | |
| Doherty James D | $910,000 | -- | |
| Vandenberghe Vincent | $470,000 | -- | |
| Paine James S | $420,000 | -- |
Source: Public Records
Mortgage History
| Date | Status | Borrower | Loan Amount |
|---|---|---|---|
| Previous Owner | Paine James S | $500,000 | |
| Previous Owner | Paine James S | $200,000 | |
| Previous Owner | Paine James S | $275,000 |
Source: Public Records
Tax History
| Year | Tax Paid | Tax Assessment Tax Assessment Total Assessment is a certain percentage of the fair market value that is determined by local assessors to be the total taxable value of land and additions on the property. | Land | Improvement |
|---|---|---|---|---|
| 2024 | $19,852 | $1,541,300 | $620,300 | $921,000 |
| 2023 | $18,765 | $1,373,700 | $530,100 | $843,600 |
| 2022 | $17,967 | $1,230,600 | $477,600 | $753,000 |
| 2021 | $17,272 | $1,129,600 | $434,200 | $695,400 |
| 2020 | $16,787 | $1,118,400 | $434,200 | $684,200 |
| 2019 | $16,472 | $1,078,700 | $404,700 | $674,000 |
| 2018 | $15,889 | $1,015,900 | $392,800 | $623,100 |
| 2017 | $15,277 | $1,006,400 | $385,100 | $621,300 |
| 2016 | $14,967 | $1,009,900 | $385,100 | $624,800 |
| 2015 | $14,606 | $975,700 | $385,100 | $590,600 |
Source: Public Records
Map
Nearby Homes
- 40 Chandler Cir
- 3 Caileigh Ct
- 37 Crenshaw Ln Unit 37
- 53 Martingale Ln
- 31 Crenshaw Ln Unit 31
- 34 Martingale Ln Unit 34
- 25 Clubview Dr Unit 25
- 21 Clubview Dr Unit 21
- 10 Dartmouth Rd
- 354 N Main St Unit 204
- 16 Balmoral St Unit 214
- 70 Washington Park Dr Unit 6
- 40C Washington Park Dr Unit 12
- 2 Powder Mill Square Unit 2B
- 20 Robert Dr Unit 20
- 12 Robert Dr Unit 12
- 11 Cuba St
- 17 Carisbrooke St
- 42 York St
- 1 Sweeney Ct
Your Personal Tour Guide
Ask me questions while you tour the home.