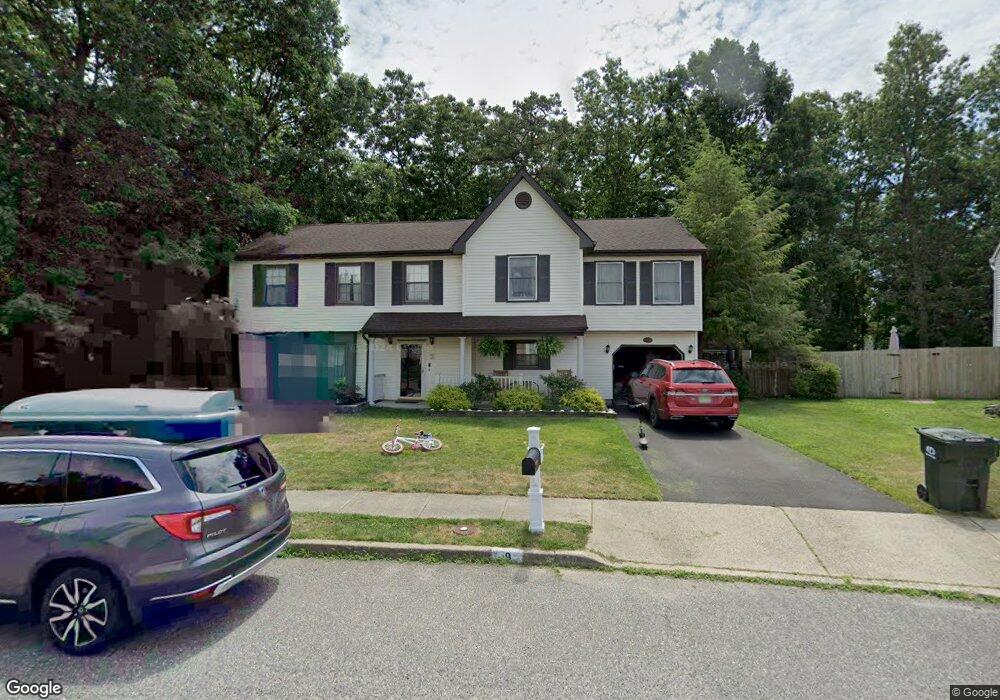
9 Eric Dr Howell, NJ 07731
Southard NeighborhoodEstimated Value: $643,000 - $721,000
4
Beds
3
Baths
2,348
Sq Ft
$297/Sq Ft
Est. Value
About This Home
This home is located at 9 Eric Dr, Howell, NJ 07731 and is currently estimated at $698,327, approximately $297 per square foot. 9 Eric Dr is a home located in Monmouth County with nearby schools including Taunton School, Aldrich School, and Howell Township Middle School South.
Ownership History
Date
Name
Owned For
Owner Type
Purchase Details
Closed on
Jun 29, 2005
Sold by
Napoli Cheryl A
Bought by
Patterson David Wesley and Make Meredith Lauren
Current Estimated Value
Home Financials for this Owner
Home Financials are based on the most recent Mortgage that was taken out on this home.
Original Mortgage
$319,000
Outstanding Balance
$160,433
Interest Rate
5.59%
Mortgage Type
New Conventional
Estimated Equity
$537,894
Create a Home Valuation Report for This Property
The Home Valuation Report is an in-depth analysis detailing your home's value as well as a comparison with similar homes in the area
Home Values in the Area
Average Home Value in this Area
Purchase History
| Date | Buyer | Sale Price | Title Company |
|---|---|---|---|
| Patterson David Wesley | $340,000 | -- |
Source: Public Records
Mortgage History
| Date | Status | Borrower | Loan Amount |
|---|---|---|---|
| Open | Patterson David Wesley | $319,000 |
Source: Public Records
Tax History
| Year | Tax Paid | Tax Assessment Tax Assessment Total Assessment is a certain percentage of the fair market value that is determined by local assessors to be the total taxable value of land and additions on the property. | Land | Improvement |
|---|---|---|---|---|
| 2025 | $10,362 | $632,600 | $369,600 | $263,000 |
| 2024 | $10,102 | $582,800 | $324,600 | $258,200 |
| 2023 | $10,102 | $542,800 | $290,600 | $252,200 |
| 2022 | $9,310 | $446,000 | $170,600 | $275,400 |
| 2021 | $9,469 | $405,500 | $160,600 | $244,900 |
| 2020 | $9,469 | $407,800 | $165,600 | $242,200 |
| 2019 | $8,846 | $373,900 | $150,600 | $223,300 |
| 2018 | $8,655 | $363,500 | $150,600 | $212,900 |
| 2017 | $8,247 | $342,500 | $136,100 | $206,400 |
| 2016 | $8,167 | $335,800 | $134,600 | $201,200 |
| 2015 | $8,160 | $332,100 | $136,100 | $196,000 |
| 2014 | $7,465 | $281,900 | $126,100 | $155,800 |
Source: Public Records
Map
Nearby Homes
Your Personal Tour Guide
Ask me questions while you tour the home.