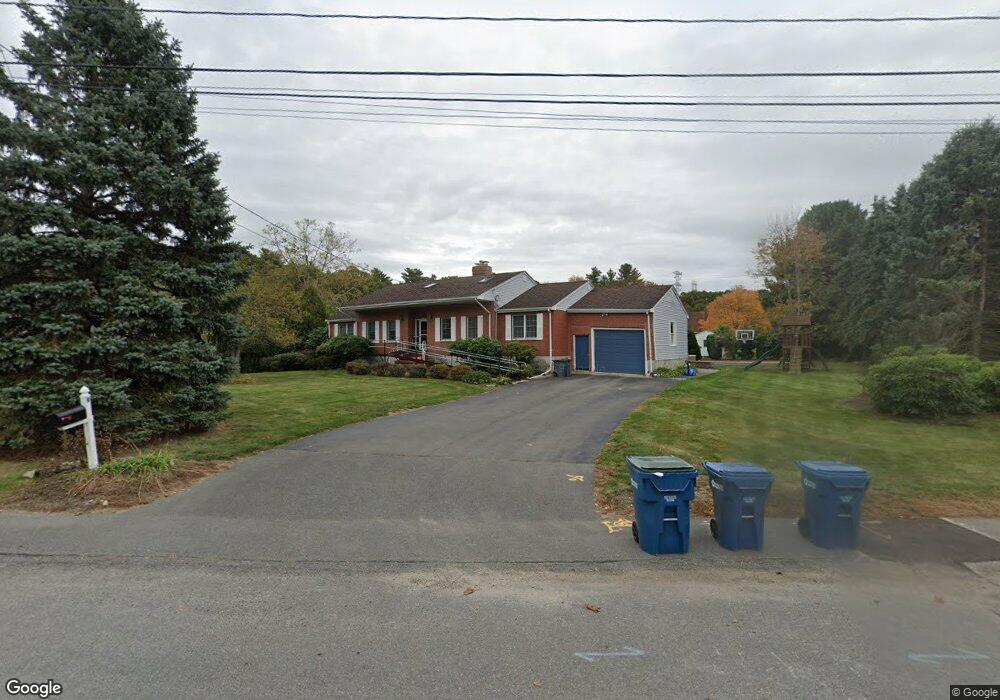
9 Estey Way Canton, MA 02021
Estimated Value: $787,000 - $947,000
3
Beds
2
Baths
2,192
Sq Ft
$391/Sq Ft
Est. Value
About This Home
This home is located at 9 Estey Way, Canton, MA 02021 and is currently estimated at $857,429, approximately $391 per square foot. 9 Estey Way is a home located in Norfolk County with nearby schools including Canton High School and St. John the Evangelist School.
Ownership History
Date
Name
Owned For
Owner Type
Purchase Details
Closed on
Mar 11, 2010
Sold by
Jones Ira R and Jones Patricia A
Bought by
Omara Scott E and Omara Tara K
Current Estimated Value
Home Financials for this Owner
Home Financials are based on the most recent Mortgage that was taken out on this home.
Original Mortgage
$285,000
Outstanding Balance
$189,269
Interest Rate
5.02%
Mortgage Type
Purchase Money Mortgage
Estimated Equity
$668,160
Purchase Details
Closed on
Sep 14, 2001
Sold by
Brancaccio Anna
Bought by
Jones Ira A and Jones Patricia A
Home Financials for this Owner
Home Financials are based on the most recent Mortgage that was taken out on this home.
Original Mortgage
$255,000
Interest Rate
6.99%
Mortgage Type
Purchase Money Mortgage
Create a Home Valuation Report for This Property
The Home Valuation Report is an in-depth analysis detailing your home's value as well as a comparison with similar homes in the area
Home Values in the Area
Average Home Value in this Area
Purchase History
| Date | Buyer | Sale Price | Title Company |
|---|---|---|---|
| Omara Scott E | $410,000 | -- | |
| Jones Ira A | $315,000 | -- |
Source: Public Records
Mortgage History
| Date | Status | Borrower | Loan Amount |
|---|---|---|---|
| Open | Omara Scott E | $285,000 | |
| Previous Owner | Jones Ira A | $255,000 |
Source: Public Records
Tax History
| Year | Tax Paid | Tax Assessment Tax Assessment Total Assessment is a certain percentage of the fair market value that is determined by local assessors to be the total taxable value of land and additions on the property. | Land | Improvement |
|---|---|---|---|---|
| 2025 | $7,540 | $762,400 | $301,700 | $460,700 |
| 2024 | $7,379 | $740,100 | $290,100 | $450,000 |
| 2023 | $7,105 | $672,200 | $290,100 | $382,100 |
| 2022 | $6,788 | $598,100 | $276,300 | $321,800 |
| 2021 | $6,662 | $546,100 | $251,200 | $294,900 |
| 2020 | $6,362 | $520,200 | $239,200 | $281,000 |
| 2019 | $6,269 | $505,600 | $217,400 | $288,200 |
| 2018 | $6,093 | $490,600 | $209,100 | $281,500 |
| 2017 | $6,047 | $472,800 | $205,000 | $267,800 |
| 2016 | $5,903 | $461,500 | $200,000 | $261,500 |
| 2015 | $5,764 | $449,600 | $194,200 | $255,400 |
Source: Public Records
Map
Nearby Homes
- 5 Trudy Terrace
- 42 Will Dr Unit 49
- 159 Stoughton St
- 55 Will Dr Unit 152
- 171 Carey Cir
- 0 Washington St Unit 72888098
- 0 Washington St Unit 71897113
- 65 Station St
- 16 Meadowood Dr
- 23 Pine St Unit K
- 27 Rosewood Dr
- 859 Pleasant St
- 19 Pine St Unit K
- 34 Rosewood Dr Unit 34
- 64 Laurelwood Dr
- 55 Rosewood Dr
- 468 Island St Unit 468
- 12 Greenbrook Dr
- 49 Elderwood Dr Unit 49
- 296 Island St
Your Personal Tour Guide
Ask me questions while you tour the home.