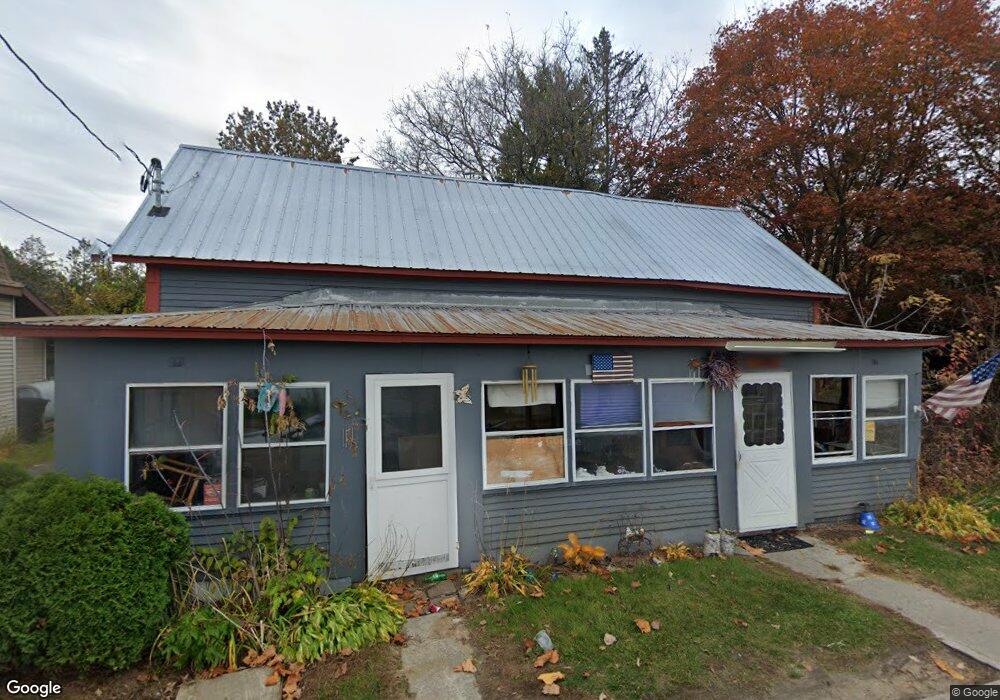
9 Forge St Au Sable Forks, NY 12912
Estimated Value: $111,000 - $156,000
3
Beds
2
Baths
1,334
Sq Ft
$104/Sq Ft
Est. Value
About This Home
This home is located at 9 Forge St, Au Sable Forks, NY 12912 and is currently estimated at $139,398, approximately $104 per square foot. 9 Forge St is a home located in Essex County with nearby schools including Ausable Valley High School and Holy Name Elementary School.
Ownership History
Date
Name
Owned For
Owner Type
Purchase Details
Closed on
Mar 13, 2020
Sold by
James Leigh Properties
Bought by
Church Bunner A
Current Estimated Value
Home Financials for this Owner
Home Financials are based on the most recent Mortgage that was taken out on this home.
Original Mortgage
$84,848
Interest Rate
3.3%
Mortgage Type
New Conventional
Purchase Details
Closed on
May 28, 2002
Purchase Details
Closed on
May 2, 2002
Sold by
Hackett Stephen W
Bought by
Atkins James C
Purchase Details
Closed on
Sep 28, 2000
Sold by
Beneficial Homeowner Serv
Bought by
Hackett William C and Hackett Stephen W
Create a Home Valuation Report for This Property
The Home Valuation Report is an in-depth analysis detailing your home's value as well as a comparison with similar homes in the area
Home Values in the Area
Average Home Value in this Area
Purchase History
| Date | Buyer | Sale Price | Title Company |
|---|---|---|---|
| Church Bunner A | $80,000 | None Available | |
| -- | -- | -- | |
| Atkins James C | $43,500 | -- | |
| Hackett William C | $12,000 | Daniel Manning |
Source: Public Records
Mortgage History
| Date | Status | Borrower | Loan Amount |
|---|---|---|---|
| Previous Owner | Church Bunner A | $84,848 |
Source: Public Records
Tax History
| Year | Tax Paid | Tax Assessment Tax Assessment Total Assessment is a certain percentage of the fair market value that is determined by local assessors to be the total taxable value of land and additions on the property. | Land | Improvement |
|---|---|---|---|---|
| 2024 | $3,138 | $111,400 | $15,800 | $95,600 |
| 2023 | $2,787 | $94,400 | $15,600 | $78,800 |
| 2022 | $2,743 | $94,400 | $15,600 | $78,800 |
| 2021 | $2,704 | $80,000 | $15,600 | $64,400 |
| 2020 | $2,174 | $66,200 | $15,600 | $50,600 |
| 2019 | $2,166 | $66,200 | $15,600 | $50,600 |
| 2018 | $1,999 | $66,200 | $15,600 | $50,600 |
| 2017 | $2,089 | $66,200 | $15,600 | $50,600 |
| 2016 | $1,997 | $66,200 | $15,600 | $50,600 |
| 2015 | -- | $66,200 | $15,600 | $50,600 |
| 2014 | -- | $66,200 | $15,600 | $50,600 |
Source: Public Records
Map
Nearby Homes
Your Personal Tour Guide
Ask me questions while you tour the home.