9 Fremont St Oxford, MA 01540
Estimated Value: $463,568 - $568,000
5
Beds
2
Baths
1,942
Sq Ft
$264/Sq Ft
Est. Value
About This Home
This home is located at 9 Fremont St, Oxford, MA 01540 and is currently estimated at $511,892, approximately $263 per square foot. 9 Fremont St is a home located in Worcester County with nearby schools including Alfred M Chaffee, Oxford High School, and Clara Barton Elementary School.
Ownership History
Date
Name
Owned For
Owner Type
Purchase Details
Closed on
Apr 19, 1990
Sold by
Hagelauer Frances C
Bought by
Hagelauer Henry D
Current Estimated Value
Home Financials for this Owner
Home Financials are based on the most recent Mortgage that was taken out on this home.
Original Mortgage
$50,000
Interest Rate
10.21%
Mortgage Type
Purchase Money Mortgage
Create a Home Valuation Report for This Property
The Home Valuation Report is an in-depth analysis detailing your home's value as well as a comparison with similar homes in the area
Home Values in the Area
Average Home Value in this Area
Purchase History
| Date | Buyer | Sale Price | Title Company |
|---|---|---|---|
| Hagelauer Henry D | $45,000 | -- |
Source: Public Records
Mortgage History
| Date | Status | Borrower | Loan Amount |
|---|---|---|---|
| Open | Hagelauer Henry D | $50,000 | |
| Closed | Hagelauer Henry D | $10,000 | |
| Closed | Hagelauer Henry D | $10,000 | |
| Closed | Hagelauer Henry D | $50,000 |
Source: Public Records
Tax History Compared to Growth
Tax History
| Year | Tax Paid | Tax Assessment Tax Assessment Total Assessment is a certain percentage of the fair market value that is determined by local assessors to be the total taxable value of land and additions on the property. | Land | Improvement |
|---|---|---|---|---|
| 2025 | $51 | $400,100 | $93,000 | $307,100 |
| 2024 | $4,997 | $370,700 | $86,200 | $284,500 |
| 2023 | $5,116 | $375,100 | $77,000 | $298,100 |
| 2022 | $4,850 | $300,100 | $66,700 | $233,400 |
| 2021 | $4,387 | $265,400 | $63,300 | $202,100 |
| 2020 | $4,008 | $240,600 | $63,300 | $177,300 |
| 2019 | $3,479 | $204,300 | $63,200 | $141,100 |
| 2018 | $3,528 | $204,300 | $63,200 | $141,100 |
| 2017 | $3,550 | $210,700 | $63,200 | $147,500 |
| 2016 | $3,567 | $210,700 | $63,200 | $147,500 |
| 2015 | $3,327 | $210,700 | $63,200 | $147,500 |
| 2014 | $3,288 | $219,200 | $63,200 | $156,000 |
Source: Public Records
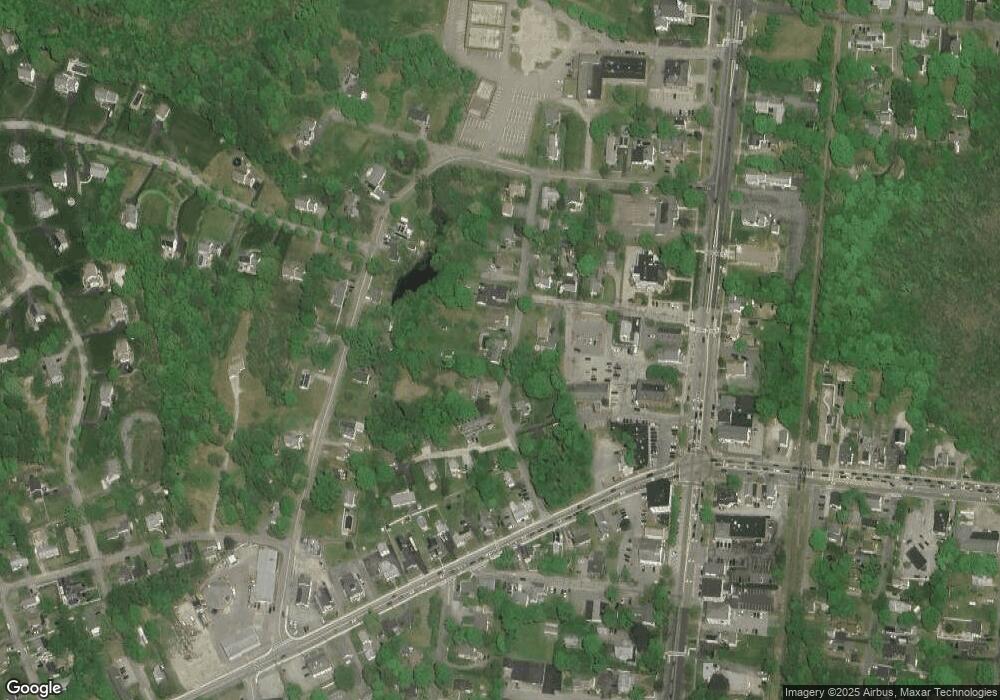
Map
Nearby Homes