9 George St Oxford, MA 01540
Estimated Value: $440,000 - $538,000
5
Beds
2
Baths
2,392
Sq Ft
$205/Sq Ft
Est. Value
About This Home
This home is located at 9 George St, Oxford, MA 01540 and is currently estimated at $490,596, approximately $205 per square foot. 9 George St is a home located in Worcester County with nearby schools including Alfred M Chaffee, Oxford High School, and Clara Barton Elementary School.
Ownership History
Date
Name
Owned For
Owner Type
Purchase Details
Closed on
Sep 11, 2006
Sold by
Loraine Albert C and Loraine Brenda G
Bought by
Loraine Albert C and Loraine Brenda G
Current Estimated Value
Home Financials for this Owner
Home Financials are based on the most recent Mortgage that was taken out on this home.
Original Mortgage
$279,000
Outstanding Balance
$168,643
Interest Rate
6.79%
Estimated Equity
$321,953
Create a Home Valuation Report for This Property
The Home Valuation Report is an in-depth analysis detailing your home's value as well as a comparison with similar homes in the area
Home Values in the Area
Average Home Value in this Area
Purchase History
| Date | Buyer | Sale Price | Title Company |
|---|---|---|---|
| Loraine Albert C | -- | -- |
Source: Public Records
Mortgage History
| Date | Status | Borrower | Loan Amount |
|---|---|---|---|
| Open | Loraine Albert C | $279,000 |
Source: Public Records
Tax History Compared to Growth
Tax History
| Year | Tax Paid | Tax Assessment Tax Assessment Total Assessment is a certain percentage of the fair market value that is determined by local assessors to be the total taxable value of land and additions on the property. | Land | Improvement |
|---|---|---|---|---|
| 2025 | $51 | $405,000 | $101,600 | $303,400 |
| 2024 | $5,046 | $374,300 | $94,400 | $279,900 |
| 2023 | $5,335 | $391,100 | $84,300 | $306,800 |
| 2022 | $4,875 | $301,700 | $68,400 | $233,300 |
| 2021 | $4,541 | $274,700 | $64,900 | $209,800 |
| 2020 | $4,197 | $251,900 | $64,900 | $187,000 |
| 2019 | $3,690 | $216,700 | $65,100 | $151,600 |
| 2018 | $3,742 | $216,700 | $65,100 | $151,600 |
| 2017 | $3,769 | $223,700 | $65,100 | $158,600 |
| 2016 | $3,787 | $223,700 | $65,100 | $158,600 |
| 2015 | $3,532 | $223,700 | $65,100 | $158,600 |
| 2014 | $3,495 | $233,000 | $65,100 | $167,900 |
Source: Public Records
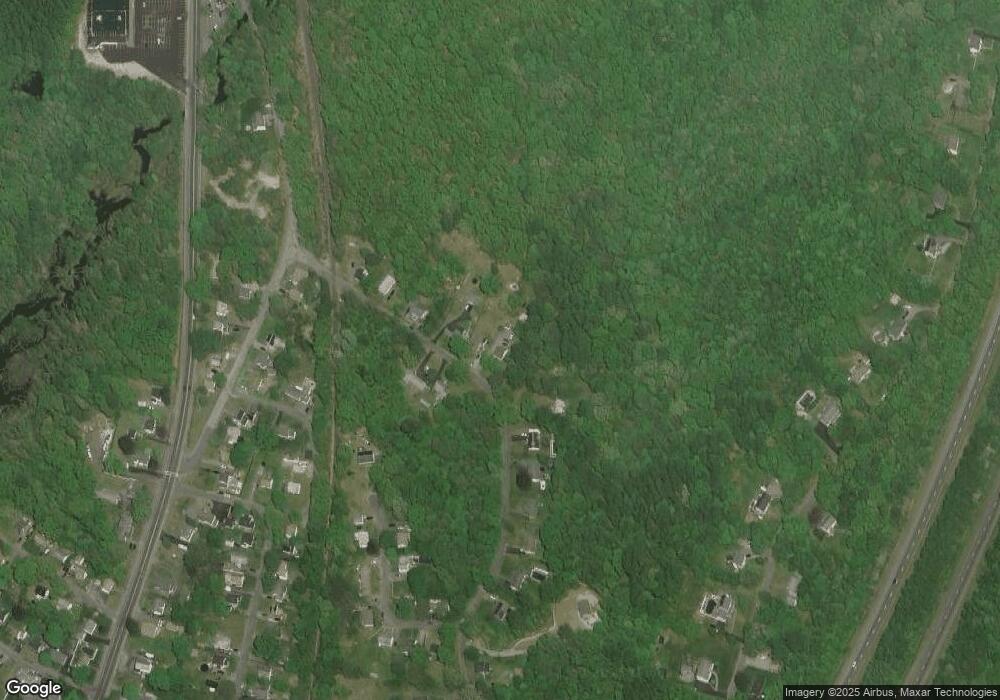
Map
Nearby Homes